Difference between revisions of "User:Jhurley/sandbox"
(→Modeling Dispersion) |
(→Modeling Diffusion) |
||
| Line 47: | Line 47: | ||
[[File:ADRFig3.png | thumb| 350px| Figure 3. Comparison of tracer breakthrough (upper graph) and cleanup curves (lower graph) from advection-dispersion based (gray lines) and advection-diffusion based (black lines) solute transport<ref name="ITRC2011">Interstate Technology and Regulatory Council (ITRC), 2011. Integrated DNAPL Site Strategy (IDSS-1), Integrated DNAPL Site Strategy Team, ITRC, Washington, DC. [https://www.enviro.wiki/images/d/d9/ITRC-2011-Integrated_DNAPL.pdf Report.pdf] Free download from: | [[File:ADRFig3.png | thumb| 350px| Figure 3. Comparison of tracer breakthrough (upper graph) and cleanup curves (lower graph) from advection-dispersion based (gray lines) and advection-diffusion based (black lines) solute transport<ref name="ITRC2011">Interstate Technology and Regulatory Council (ITRC), 2011. Integrated DNAPL Site Strategy (IDSS-1), Integrated DNAPL Site Strategy Team, ITRC, Washington, DC. [https://www.enviro.wiki/images/d/d9/ITRC-2011-Integrated_DNAPL.pdf Report.pdf] Free download from: | ||
[https://itrcweb.org/GuidanceDocuments/IntegratedDNAPLStrategy_IDSSDoc/IDSS-1.pdf ITRC]</ref>.]] | [https://itrcweb.org/GuidanceDocuments/IntegratedDNAPLStrategy_IDSSDoc/IDSS-1.pdf ITRC]</ref>.]] | ||
| − | [[Matrix Diffusion]] describes the gradual transport of dissolved contaminants from higher concentration and higher hydraulic conductivity (''K'') zones into low ''K'' zones by [[wikipedia:Molecular diffusion | molecular diffusion]]. The contaminants can then diffuse back out of these low ''K'' zones once the contaminant source is removed and the high ''K'' zone contaminant concentration decreases. In some cases, matrix diffusion can maintain contaminant concentrations in more permeable zones | + | [[Matrix Diffusion]] describes the gradual transport of dissolved contaminants from higher concentration and higher hydraulic conductivity (''K'') zones into low ''K'' zones by [[wikipedia:Molecular diffusion | molecular diffusion]]. The contaminants can then diffuse back out of these low ''K'' zones once the contaminant source is removed and the high ''K'' zone contaminant concentration decreases. In some cases, matrix diffusion can maintain contaminant concentrations in more permeable zones at greater than target cleanup goals for decades or even centuries after the primary sources have been addressed<ref name="Chapman2005">Chapman, S.W. and Parker, B.L., 2005. Plume persistence due to aquitard back diffusion following dense nonaqueous phase liquid source removal or isolation. Water Resources Research, 41(12), Report W12411. [https://doi.org/10.1029/2005WR004224 DOI: 10.1029/2005WR004224] [[Media:Chapman2005.pdf | Report.pdf]] Free access article from [https://agupubs.onlinelibrary.wiley.com/doi/full/10.1029/2005WR004224 American Geophysical Union]</ref>. (See also [[Matrix Diffusion]].) |
===Impacts on Breakthrough Curves=== | ===Impacts on Breakthrough Curves=== | ||
Revision as of 09:13, 15 September 2020
Advection-Dispersion-Reaction Equation for Solute Transport
The transport of dissolved solutes in groundwater is often modeled using the Advection-Dispersion-Reaction (ADR) equation. Advection refers to the bulk movement of solutes carried by flowing groundwater. Dispersion refers to the spreading of the contaminant plume from highly concentrated areas to less concentrated areas. Dispersion coefficients are calculated as the sum of molecular diffusion, mechanical dispersion, and macrodispersion. Reaction refers to changes in the mass of the solute within the system resulting from biotic and abiotic processes.
Related Article(s):
- Advection and Groundwater Flow
- Dispersion and Diffusion
- Sorption of Organic Contaminants
- Plume Response Modeling
CONTRIBUTOR(S):
Key Resource(s):
- Groundwater[1], Freeze and Cherry, 1979.
- Hydrogeologic Properties of Earth Materials and Principals of Groundwater Flow[2], Woessner and Poeter, 2020.
The ADR Equation
In many groundwater transport models, solute transport is described by the advection-dispersion-reaction equation. As shown below (Equation 1), the ADR equation describes the change in dissolved solute concentration (C) over time (t) where groundwater flow is oriented along the x direction.
- Where:
- R is the linear, equilibrium retardation factor (see Sorption of Organic Contaminants),
- Dx, Dy, and Dz are hydrodynamic dispersion coefficients in the x, y and z directions (L2/T),
- v is the advective transport or seepage velocity in the x direction (L/T), and
- λ is an effective first order decay rate due to combined biotic and abiotic processes (1/T).
The term on the left side of the equation is the rate of mass change per unit volume. On the right side are terms representing the solute flux due to dispersion in the x, y, and z directions, the advective flux in the x direction, and the first order decay due to biotic and abiotic processes. Dispersion coefficients (Dx,y,z) are commonly estimated using the following relationships:
- Where:
- Dm is the molecular diffusion coefficient (L2/T), and
- αL, αT, and αV are the longitudinal, transverse and vertical dispersivities (L).
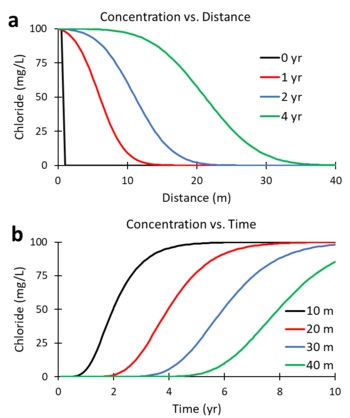
Figures 1a and 1b were generated using a numerical solution of the ADR equation for a non-reactive tracer (R = 1; λ = 0) with v = 5 m/yr and Dx = 10 m2/yr. Figure 1a shows the predicted change in concentration of the tracer, chloride, versus distance downgradient from the continuous contaminant source at different times (0, 1, 2, and 4 years). Figure 1b shows the change in concentration versus time (commonly referred to as the breakthrough curve or BTC) at different downgradient distances (10, 20, 30 and 40 m). At 2 years, the mid-point of the concentration versus distance curve (Figure 1a) is located 10 m downgradient (x = 5 m/yr * 2 yr). At 20 m downgradient, the mid-point of the concentration versus time curves (Figure 1b) occurs at 4 years (t = 20 m / 5 m/yr).
Modeling Dispersion
The dispersion coefficient in the ADR equation accounts for the combined effects of molecular diffusion and mechanical dispersion, both of which cause spreading of the contaminant plume from highly concentrated areas toward less concentrated areas. Molecular diffusion is the result of the thermal motion of individual molecules which causes a flux of dissolved solutes from areas of higher concentration to areas of lower concentration. Mechanical dispersion (hydrodynamic dispersion) results from groundwater moving at rates that vary from the average linear velocity. Because the invading solute-containing water does not travel at the same velocity everywhere, mixing occurs along flow paths. Typical values of the mechanical dispersivity measured in laboratory column tests are on the order of 0.01 to 1 cm[3].
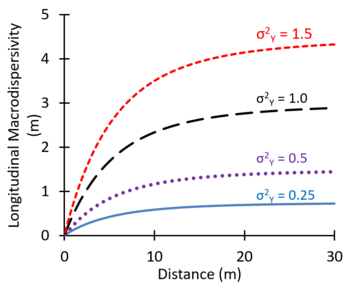
Spatial variations in hydraulic conductivity can increase the apparent spreading of solute plumes observed in groundwater monitoring wells. This spreading of the solute caused by large-scale heterogeneities in the aquifer and the associated spatial variations in advective transport velocity is referred to as macrodispersion. In some groundwater modeling projects, large values of dispersivity are used as an adjustment factor to better represent the observed large-scale spreading of plumes[4]. Theoretical studies suggest that macrodispersivity will increase with distance near the source, and then increase more slowly farther downgradient, eventually approaching an asymptotic value[5][6][7]. Figure 2 shows values of macrodispersivity calculated using the theory of Dagan[7] with an autocorrelation length of 3 m and several different values of the variance of Y (σ2Y) where Y = Log K. The calculated macrodispersivity increases more rapidly and reaches higher asymptotic values for more heterogeneous aquifers with greater variations in K (larger σ2Y). The maximum predicted dispersivity values are in the range of 0.5 to 5 m.
Modeling Diffusion

Matrix Diffusion describes the gradual transport of dissolved contaminants from higher concentration and higher hydraulic conductivity (K) zones into low K zones by molecular diffusion. The contaminants can then diffuse back out of these low K zones once the contaminant source is removed and the high K zone contaminant concentration decreases. In some cases, matrix diffusion can maintain contaminant concentrations in more permeable zones at greater than target cleanup goals for decades or even centuries after the primary sources have been addressed[9]. (See also Matrix Diffusion.)
Impacts on Breakthrough Curves
The impacts of matrix diffusion on the initial breakthrough of the solute plume and later cleanup are illustrated in Figure 3[8]. Using a traditional advection-dispersion model, the breakthrough curve for a pulse tracer injection appears as a bell-shaped (Gaussian) curve (gray line on the right side of the upper graph) where the peak arrival time corresponds to the average groundwater velocity. Using an advection-diffusion approach, the breakthrough curve for a pulse injection is asymmetric (solid black line) with the peak tracer concentration arriving earlier than would be expected based on the average groundwater velocity, but with a long extended tail to the flushout curve.
The lower graph shows the predicted cleanup concentration profiles following complete elimination of a source area. The advection-dispersion model (gray line) predicts a clean-water front arriving at a time corresponding to the average groundwater velocity. The advection-diffusion model (black line) predicts that concentrations will start to decline more rapidly than expected (based on the average groundwater velocity) as clean water rapidly migrates through the highest-permeability strata. However, low but significant contaminant concentrations linger much longer (tailing) due to diffusive contaminant mass exchange between zones of high and low permeability.
ADR Applications
The ADR equation can be solved to find the spatial and temporal distribution of solutes using a variety of analytical and numerical approaches. The design tools BIOSCREEN[10], BIOCHLOR[11], and REMChlor[12] (see also REMChlor - MD) employ an analytical solution of the ADR equation. MT3DMS[13] uses a numerical method to solve the ADR equation using the head distribution generated by the groundwater flow model MODFLOW[14].
References
- ^ Freeze, A., and Cherry, J., 1979. Groundwater, Prentice-Hall, Englewood Cliffs, New Jersey, 604 pages. Free download from Hydrogeologists Without Borders.
- ^ Woessner, W.W., and Poeter, E.P., 2020. Properties of Earth Materials and Principals of Groundwater Flow, The Groundwater Project, Guelph, Ontario, 207 pages. Free download from The Groundwater Project.
- ^ Anderson, M.P. and Cherry, J.A., 1979. Using models to simulate the movement of contaminants through groundwater flow systems. Critical Reviews in Environmental Science and Technology, 9(2), pp.97-156. DOI: 10.1080/10643387909381669
- ^ Interstate Technology and Regulatory Council (ITRC), 2015. Integrated DNAPL Site Characterization and Tools Selection (ISC-1), DNAPL Site Characterization Team, ITRC, Washington, DC. Report.pdf Free download from: ITRC
- ^ Gelhar, L.W., Gutjahr, A.L. and Naff, R.L., 1979. Stochastic analysis of macrodispersion in a stratified aquifer. Water Resources Research, 15(6), pp.1387-1397. DOI:10.1029/WR015i006p01387
- ^ Gelhar, L.W. and Axness, C.L., 1983. Three‐dimensional stochastic analysis of macrodispersion in aquifers. Water Resources Research, 19(1), pp.161-180. DOI:10.1029/WR019i001p00161
- ^ 7.0 7.1 Dagan, G., 1988. Time‐dependent macrodispersion for solute transport in anisotropic heterogeneous aquifers. Water Resources Research, 24(9), pp.1491-1500. DOI:10.1029/WR024i009p01491
- ^ 8.0 8.1 Interstate Technology and Regulatory Council (ITRC), 2011. Integrated DNAPL Site Strategy (IDSS-1), Integrated DNAPL Site Strategy Team, ITRC, Washington, DC. Report.pdf Free download from: ITRC
- ^ Chapman, S.W. and Parker, B.L., 2005. Plume persistence due to aquitard back diffusion following dense nonaqueous phase liquid source removal or isolation. Water Resources Research, 41(12), Report W12411. DOI: 10.1029/2005WR004224 Report.pdf Free access article from American Geophysical Union
- ^ Newell, C.J., McLeod, R.K. and Gonzales, J.R., 1996. BIOSCREEN: Natural Attenuation Decision Support System - User's Manual, Version 1.3. US Environmental Protection Agency, EPA/600/R-96/087. Report.pdf BIOSCREEN website
- ^ Aziz, C.E., Newell, C.J., Gonzales, J.R., Haas, P.E., Clement, T.P. and Sun, Y., 2000. BIOCHLOR Natural Attenuation Decision Support System. User’s Manual - Version 1.0. US Environmental Protection Agency, EPA/600/R-00/008. Report.pdf BIOCHLOR website
- ^ Falta, R.W., Stacy, M.B., Ahsanuzzaman, A.N.M., Wang, M. and Earle, R.C., 2007. REMChlor Remediation Evaluation Model for Chlorinated Solvents - User’s Manual, Version 1.0. US Environmental Protection Agency. Center for Subsurface Modeling Support, Ada, OK. Report.pdf REMChlor website
- ^ Zheng, C. and Wang, P.P., 1999. MT3DMS: A Modular Three-Dimensional Multispecies Transport Model for Simulation of Advection, Dispersion, and Chemical Reactions of Contaminants in Groundwater Systems; Documentation and User’s Guide. Contract Report SERDP-99-1 U.S. Army Engineer Research and Development Center, Vicksburg, MS. Report.pdf MT3DMS website
- ^ McDonald, M.G. and Harbaugh, A.W., 1988. A Modular Three-dimensional Finite-difference Ground-water Flow Model, Techniques of Water-Resources Investigations, Book 6, Modeling Techniques. U.S. Geological Survey, 586 pages. DOI: 10.3133/twri06A1 Report.pdf Free MODFLOW download from: USGS


