File:Wilson1w2Fig6.png
Revision as of 16:22, 9 January 2020 by Debra Tabron (talk | contribs) (Figure 6. Example calibration of NAS to predict the reduced concentration at the source that is necessary to meet the remediation goal at a point-of-compliance well (Figure 19 of NAS User’s Manual).)

Size of this preview: 790 × 600 pixels. Other resolutions: 316 × 240 pixels | 898 × 682 pixels.
Original file (898 × 682 pixels, file size: 236 KB, MIME type: image/png)
Summary
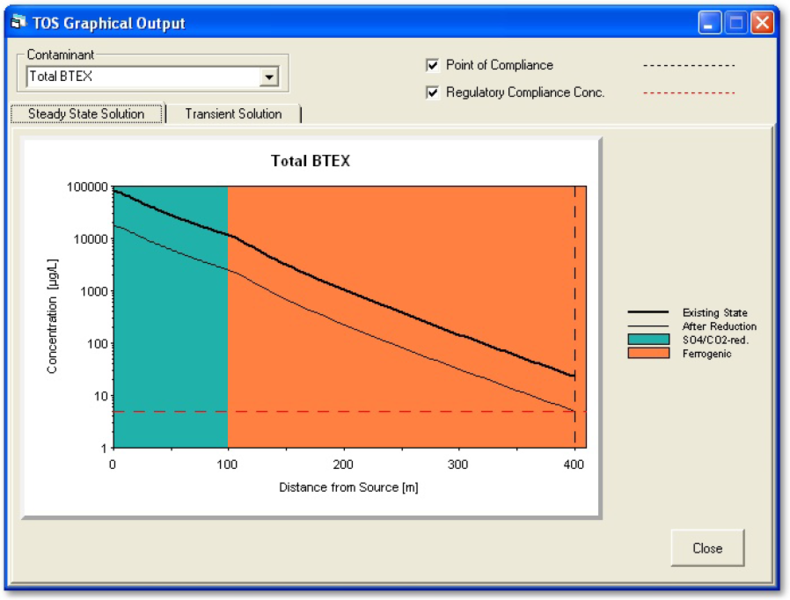
Figure 6. Example calibration of NAS to predict the reduced concentration at the source that is necessary to meet the remediation goal at a point-of-compliance well (Figure 19 of NAS User’s Manual).
File history
Click on a date/time to view the file as it appeared at that time.
| Date/Time | Thumbnail | Dimensions | User | Comment | |
|---|---|---|---|---|---|
| current | 16:22, 9 January 2020 |  | 898 × 682 (236 KB) | Debra Tabron (talk | contribs) | Figure 6. Example calibration of NAS to predict the reduced concentration at the source that is necessary to meet the remediation goal at a point-of-compliance well (Figure 19 of NAS User’s Manual). |
- You cannot overwrite this file.
File usage
The following page links to this file: