File:Liu1w2 Fig9C.png

Size of this preview: 800 × 440 pixels. Other resolutions: 320 × 176 pixels | 845 × 465 pixels.
Original file (845 × 465 pixels, file size: 56 KB, MIME type: image/png)
Summary
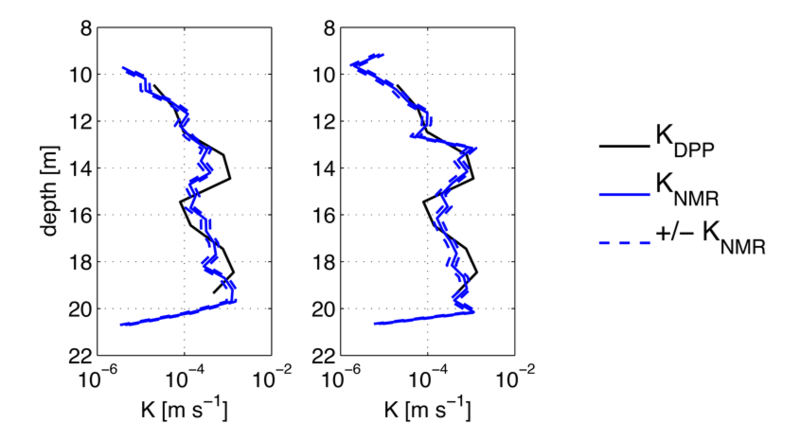
Figure 9C. Comparison of NMR and DPP K estimates at two GEMS locations. The dash lines show the range of the NMR K estimates due to the uncertainty in the empirical parameters used in the pore size - K relationship. (Knight et al., 2016)
File history
Click on a date/time to view the file as it appeared at that time.
| Date/Time | Thumbnail | Dimensions | User | Comment | |
|---|---|---|---|---|---|
| current | 13:37, 5 March 2019 |  | 845 × 465 (56 KB) | Debra Tabron (talk | contribs) | Figure 9C. Comparison of NMR and DPP ''K'' estimates at two GEMS locations. The dash lines show the range of the NMR ''K'' estimates due to the uncertainty in the empirical parameters used in the pore size - ''K'' relationship. (Knight et al., 2016) |
- You cannot overwrite this file.
File usage
The following page links to this file: