File:Taylor-A1-Figure 5.PNG
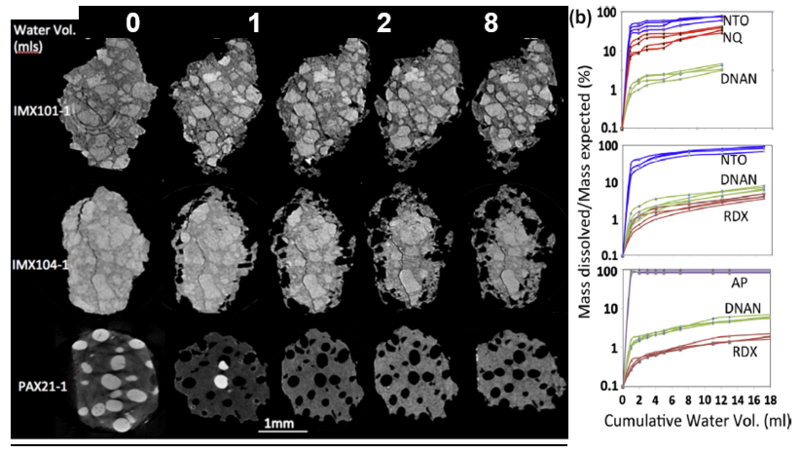
Revision as of 14:06, 17 October 2016 by Debra Tabron (talk | contribs) (Figure 5. (a) µCT images of an IMX101, IMX104 and PAX21 particle during dissolution. (b) the mass loss curves for these and three other sets of particles (Taylor et al. 2015a).)

Size of this preview: 800 × 452 pixels. Other resolutions: 320 × 181 pixels | 822 × 464 pixels.
Original file (822 × 464 pixels, file size: 289 KB, MIME type: image/png)
Figure 5. (a) µCT images of an IMX101, IMX104 and PAX21 particle during dissolution. (b) the mass loss curves for these and three other sets of particles (Taylor et al. 2015a).
File history
Click on a date/time to view the file as it appeared at that time.
| Date/Time | Thumbnail | Dimensions | User | Comment | |
|---|---|---|---|---|---|
| current | 14:06, 17 October 2016 |  | 822 × 464 (289 KB) | Debra Tabron (talk | contribs) | Figure 5. (a) µCT images of an IMX101, IMX104 and PAX21 particle during dissolution. (b) the mass loss curves for these and three other sets of particles (Taylor et al. 2015a). |
- You cannot overwrite this file.
File usage
The following page links to this file: