File:Bekins1w2 Fig5.jpg
Revision as of 12:56, 13 June 2019 by Debra Tabron (talk | contribs) (Figure 5. Concentrations of nonvolatile dissolved organic carbon (NVDOC) and total petroleum hydrocarbons in the diesel range (TPHd) measured along the centerline of the north pool plume in August 2016. Well locations and oil spill source location sho...)
Bekins1w2_Fig5.jpg (716 × 518 pixels, file size: 39 KB, MIME type: image/jpeg)
Summary
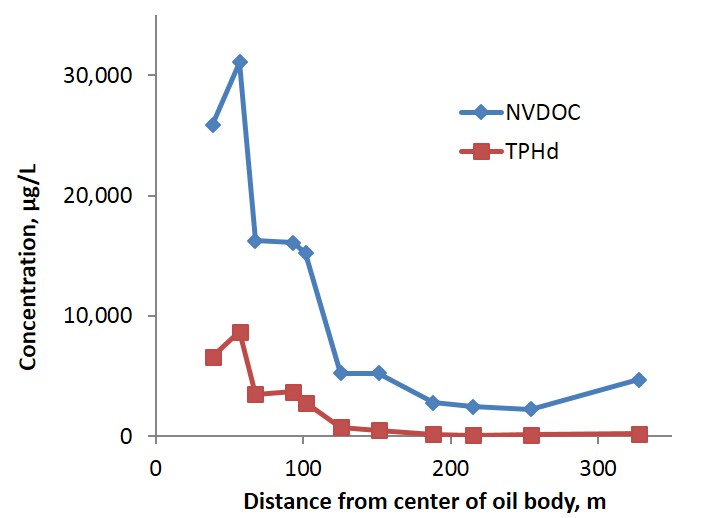
Figure 5. Concentrations of nonvolatile dissolved organic carbon (NVDOC) and total petroleum hydrocarbons in the diesel range (TPHd) measured along the centerline of the north pool plume in August 2016. Well locations and oil spill source location shown in Figure 1 of this article. Figure reprinted from McGuire, et al., 2018.
File history
Click on a date/time to view the file as it appeared at that time.
| Date/Time | Thumbnail | Dimensions | User | Comment | |
|---|---|---|---|---|---|
| current | 12:56, 13 June 2019 |  | 716 × 518 (39 KB) | Debra Tabron (talk | contribs) | Figure 5. Concentrations of nonvolatile dissolved organic carbon (NVDOC) and total petroleum hydrocarbons in the diesel range (TPHd) measured along the centerline of the north pool plume in August 2016. Well locations and oil spill source location sho... |
- You cannot overwrite this file.
File usage
The following page links to this file:
