Difference between revisions of "Long-Term Monitoring (LTM) - Data Variability"
m (1 revision imported) |
m (1 revision imported) |
(No difference)
| |
Revision as of 15:16, 3 May 2018
Long-term monitoring (LTM) data is used for assessing remediation processes and attainment of site-specific clean up goals. Unfortunately, short-term variability in the monitoring results can make it harder to identify the long-term trend(s). This short-term variability appears to be mostly associated with the contaminant plume. Sample analysis method, collection method, or monitoring well construction typically has little impact on this short-term variability. The Excel-based Monitoring Optimization and Trend Analysis Toolkit allows site managers to understand and control for the effect of short-term variability on the analysis of long-term concentration trends.
Related Article(s):
CONTRIBUTOR(S): Dr. Thomas McHugh and Dr. David Adamson, P.E.
Key Resource(s):
Introduction
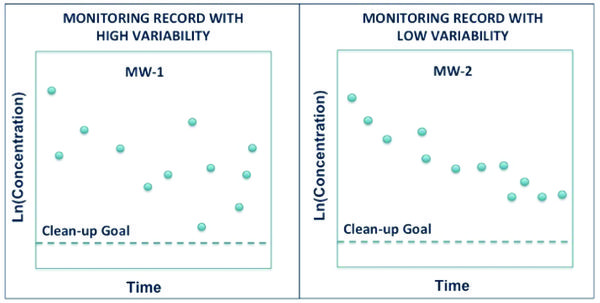
The primary goal of long-term monitoring (LTM) is to understand how contaminant concentrations (usually in groundwater) change over years. In contrast, short-term variability is the event-to-event change in concentrations that are unrelated to the long-term trend. Short-term variability adds noise (i.e., randomness) to the monitoring record that can make it more difficult to determine the true long-term change in contaminant concentration over time (Fig. 1).
Effects of Short-Term Data Variability
The two principal ways short-term data variability compromise long-term monitoring results:
Evaluating Remedy Effectiveness
Short-term variability in monitoring results complicate long-term data analysis by 1) making it more difficult to interpret the results through visual inspection, and 2) increasing the amount of monitoring data needed to characterize the long-term trend through statistical analyses. Monitoring costs are increased because more data are needed and decisions are delayed before the trend becomes clear. In the worst cases, incorrect conclusions regarding remediation performance assessment are made because the short-term variability results are incorrectly interpreted as an apparent long-term trend.
Evaluating Differences Between Wells
Observed differences in attenuation between monitoring wells may be due to either 1) the effect of short-term variability causing random variations in apparent attenuation or 2) true spatial differences in contaminant attenuation. True differences in attenuation rates may be caused by spatial variations in the effects of active remediation systems (for sites with active remediation), the presence of multiple source areas with different attenuation rates, or spatial differences in plume attenuation due to differences in matrix diffusion or other contaminant fate processes. Accurately distinguishing between random variations in well-specific attenuation rates and true spatial differences in plume attenuation is important for evaluating the effectiveness of site remediation.
Sources of Short-Term Data Variability
Sampling event-to-sampling event data variability in groundwater monitoring results may be associated with: 1) analytical variability at the laboratory, 2) sample collection, or 3) signal variability (i.e., inherent variability within the aquifer). We discuss each of these issues directly below.
- Analytical Variability: When all samples are analyzed at the same laboratory, laboratory variability is not an important source of monitoring variability. Contaminant concentrations in field duplicate samples typically show a relative percent difference (RPD) of <10%. This level of variability is usually much smaller than the variation in contaminant concentration between samples collected from the same monitoring well over days or weeks[1]. It is also smaller than the variability observed between paired samples collected from a monitoring well on the same day, but at two different purge volumes. Although commercial laboratories have very high precision (i.e., they report very similar results when analyzing the same sample multiple times), results reported by different laboratories for the same sample commonly differ by 30% or more due to differences in instrument calibration[2][3]. Thus, switching sample analysis from one laboratory to another may result in a one-time change in monitoring results[1].
- Sample Collection Method Variability: In general, the sample collection method does not affect event-to-event variability in groundwater monitoring results. A study comparing two Groundwater Sampling - No-Purge/Passive methods (SNAP and HydraSleeve) and three variations of low flow purge sampling at two sites found that the collection methods had little impact on event-to-event variability[4]. However, an analysis of monitoring datasets from three sites found that results obtained using a HydraSleeve sampler may be low biased and are more variable in some settings[5].
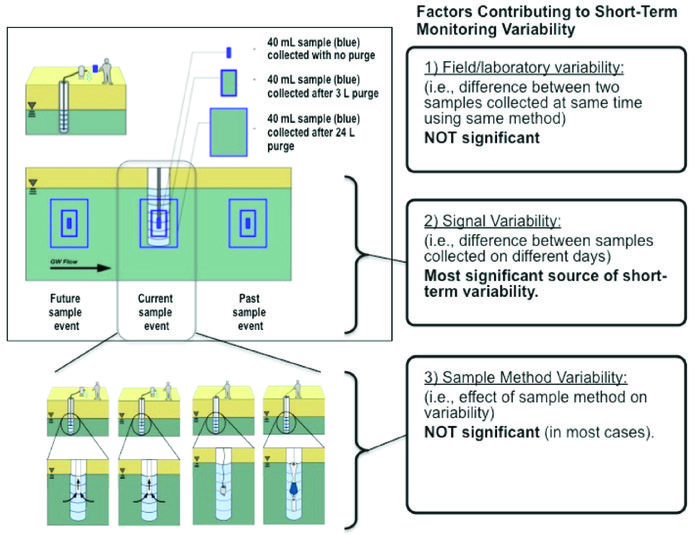
- Signal Variability: Signal variability (i.e., the actual concentration variability in the water within the aquifer) is the most important source of variability in groundwater monitoring results[1][6]. In addition to long-term source attenuation, contaminant concentrations in water moving through an aquifer (and through a monitoring well) vary up and down in response to a wide variety of solute transport factors including groundwater flow direction, groundwater elevation, and variations in degradation rates. At most sites, these factors result in a contaminant plume that is spatiotemporally variable. This variability in contaminant distribution creates an inherent level of inconsistency in groundwater monitoring results. As a result, groundwater samples collected days or weeks apart from the same monitoring well using the same sampling method commonly show high variations in contaminant concentrations relative to the expected change based on the long-term attenuation rate. Although perhaps unintuitive, monitoring well construction, well placement within the aquifer, and sampling method have little or no impact on this inherent variability[1].
These issues provide the foundation for a conceptual model of factors contributing to short-term data variability (Fig. 2).
Approaches to Manage Variability in LTM Results
In general, groundwater sampling methods should be selected based on cost, ease of use, and sample volume requirements. This is because, for most sites, sample collection methods seem to have little or no impact on data variability[4][6]
Long-Term Monitoring Data Analysis should utilize methods and procedures that account for the inherent event-to-event variability in monitoring results. The ESTCP program supported the development of a new method to evaluate attenuation rates and optimize monitoring frequency based on the short-term variability and long-term attenuation rate at a particular site[6]. This evaluation method has been incorporated into an Excel-based spreadsheet tool called The Monitoring Optimization and Trend Analysis Toolkit[7]. This tool helps a user evaluate remedy effectiveness by evaluation of attenuation rates and spatial differences in attenuation rates. It quantitatively accounts for short-term variability in helping the user answer the following questions:
- How much monitoring data do I need to determine a site’s long-term source attenuation rate with a defined level of accuracy or confidence?
- Do any individual wells appear to be attenuating more slowly than the source as a whole?
Summary
Short-term variability in groundwater concentration vs. time data makes it more difficult to discern trends and make remediation decisions. A study of the sources of variability concluded that analytical lab variability is relatively small, as is the way monitoring wells are constructed and sampled. A new tool is available to help answer questions about how much data are needed to understand underlying trends in groundwater monitoring temporal data[7].
References
- ^ 1.0 1.1 1.2 1.3 1.4 McHugh, T.E., Beckley, L.M., Liu, C.Y. and Newell, C.J., 2011. Factors influencing variability in groundwater monitoring data sets. Groundwater Monitoring & Remediation, 31(2), 92-101. doi: 10.1111/j.1745-6592.2011.01337.x
- ^ Wehrmann, H.A., Barcelona, M.J., Varljen, M.D., and Blinkiewicz, G., 1996. Groundwater contamination by volatile organic compounds: site characterization, spatial and temporal variability. Illinois State Water Survey Contract Report 591, Table 9. Report pdf
- ^ Keith, S.J., Wilson, L.G., Fitch, H.R. and Esposito, D.M., 1983. Sources of spatial-temporal variability on groundwater quality data and methods of control. Groundwater Monitoring & Remediation, 3(2), 21-32. doi: 10.1111/j.1745-6592.1983.tb01196.x
- ^ 4.0 4.1 Kulkarni, P.R., Krebs, C.J., Britt, S., Newell, C.J., McHugh, T.E., in review. Effect of groundwater sampling methods on short-term variability and concentration bias: two field sites.
- ^ McHugh, T.E., Kulkarni, P.R., Beckley, L.M., Newell, C.J. and Zumbro, M., 2015. Negative bias and increased variability in VOC concentrations using the HydraSleeve in monitoring wells. Groundwater Monitoring & Remediation, 36, 79–87. doi: 10.1111/gwmr.12141
- ^ 6.0 6.1 6.2 McHugh, T.E., Kulkarni, P.R., Krebs, C., Newell, C.J., Sanford, B., 2015. Methods for minimization and management of variability in long-term groundwater monitoring results. Final Report ER-201209. ER201209
- ^ 7.0 7.1 McHugh, T.E., Kulkarni, P.R., Beckley, L.M., Newell, C.J., Strasters, B., 2015. Methods for minimization and management of variability in long-term groundwater monitoring results. A new method to optimize monitoring frequency and evaluate long-term concentration trends, Technical Report, Task 2 & 3. ER-201209. ER-201209

