Difference between revisions of "Monitored Natural Attenuation (MNA) of Chlorinated Solvents"
m (1 revision imported) |
|||
| Line 14: | Line 14: | ||
'''Key Resource(s):''' | '''Key Resource(s):''' | ||
| − | *[ | + | *[http://www.environmentalrestoration.wiki/images/8/8d/He-2009-Identification_and_characterization_methods_for_reactive_minerals_.pdf Identification & Characterization Methods for Reactive Minerals Responsible for Natural Attenuation of Chlorinated Organic Compounds in Ground Water]<ref name="HE2009">He, Y., Su, C., Wilson, J., Wilkin, R., Adair, C., Lee, T., Bradley, P. and Ferrey, M., 2009. Identification and characterization methods for reactive minerals responsible for natural attenuation of chlorinated organic compounds in ground water. U.S. Environmental Protection Agency. [http://www.environmentalrestoration.wiki/images/8/8d/He-2009-Identification_and_characterization_methods_for_reactive_minerals_.pdf Report pdf]</ref> |
==Introduction== | ==Introduction== | ||
| − | [[Chlorinated Solvents |Chlorinated solvents]] and their transformation products are among the most abundant contaminants in groundwater. In 2006, the United States Geological Survey published results from a systematic survey of volatile organic chemicals in drinking water wells<ref>Zogorski, J.S., Carter, J.M., Ivahnenko, T., Lapham, W.W., Moran, M.J., Rowe, B.L., Squillace, P.J., Toccalino, P.L., 2006. The quality of our Nation’s waters - Volatile organic compounds in the nation’s ground water and drinking-water supply wells. US Geological Survey Circular, 1292, 101. [ | + | [[Chlorinated Solvents |Chlorinated solvents]] and their transformation products are among the most abundant contaminants in groundwater. In 2006, the United States Geological Survey published results from a systematic survey of volatile organic chemicals in drinking water wells<ref>Zogorski, J.S., Carter, J.M., Ivahnenko, T., Lapham, W.W., Moran, M.J., Rowe, B.L., Squillace, P.J., Toccalino, P.L., 2006. The quality of our Nation’s waters - Volatile organic compounds in the nation’s ground water and drinking-water supply wells. US Geological Survey Circular, 1292, 101. [http://www.environmentalrestoration.wiki/images/e/e4/Zogorski-2006-_Volatile_organic_compounds_in_the_nations_ground_water_and_wells.pdf Report pdf]</ref> in the USA. Approximately 12% of wells contained detectable concentrations of tetrachloromethane ([[wikipedia: Chloroform | chloroform]]), 5% contained [[wikipedia: Tetrachloroethylene | tetrachloroethene (PCE)]], 4% contained [[wikipedia: Trichloroethylene | trichloroethene (TCE)]], 2% contained [[wikipedia: 1,1,1-Trichloroethane | 1,1,1-trichloroethane (1,1,1-TCA)]], and 2% contained [[wikipedia: 1,1-Dichloroethane | 1,1-dichloroethane (1,1-DCA)]]. |
[[Monitored Natural Attenuation (MNA) | Monitored Natural Attenuation (MNA)]] is one remedy that is available for contamination from chlorinated solvents in groundwater. Natural processes that can attenuate the concentrations of chlorinated solvents in groundwater include biological degradation, abiotic degradation, sorption, dispersion into ground adjacent to the contaminant plume, and volatilization to soil gas above the groundwater. At most sites where MNA has been selected as a remedy, or part of a remedy, the chlorinated solvents have been shown to be degrading in groundwater. | [[Monitored Natural Attenuation (MNA) | Monitored Natural Attenuation (MNA)]] is one remedy that is available for contamination from chlorinated solvents in groundwater. Natural processes that can attenuate the concentrations of chlorinated solvents in groundwater include biological degradation, abiotic degradation, sorption, dispersion into ground adjacent to the contaminant plume, and volatilization to soil gas above the groundwater. At most sites where MNA has been selected as a remedy, or part of a remedy, the chlorinated solvents have been shown to be degrading in groundwater. | ||
| Line 24: | Line 24: | ||
The prospects for degradation of selected chlorinated solvents and their transformation products in groundwater are good (Table 1). | The prospects for degradation of selected chlorinated solvents and their transformation products in groundwater are good (Table 1). | ||
| − | [[File:Wilson 3 Table1.JPG|thumbnail|600 px|left|Table 1. Summary of the prospects for degradation of selected chlorinated solvents and their transformation products in groundwater<ref>Lawrence, S.J., 2006. Description, properties, and degradation of selected volatile organic compounds detected in ground water--A review of selected literature (No. 2006-1338). [ | + | [[File:Wilson 3 Table1.JPG|thumbnail|600 px|left|Table 1. Summary of the prospects for degradation of selected chlorinated solvents and their transformation products in groundwater<ref>Lawrence, S.J., 2006. Description, properties, and degradation of selected volatile organic compounds detected in ground water--A review of selected literature (No. 2006-1338). [http://www.environmentalrestoration.wiki/images/5/5f/Lawrence-2006-Description_properties_degradation_of_VOCs.pdf Report pdf]</ref><ref name="HE2009"/>]] |
Biodegradation can occur under both aerobic and anaerobic conditions. Under aerobic conditions, the chlorinated solvent can act as a source of food for the microorganisms (referred to as direct biodegradation in Table 1). Degradation can also be a fortuitous reaction that does not provide any benefit to the microorganisms. The fortuitous reaction is called a cometabolism or cooxidation. The fortuitous reaction is most commonly carried out by an oxygenase enzyme that is produced by the microorganisms in order to allow them to degrade some other compound. | Biodegradation can occur under both aerobic and anaerobic conditions. Under aerobic conditions, the chlorinated solvent can act as a source of food for the microorganisms (referred to as direct biodegradation in Table 1). Degradation can also be a fortuitous reaction that does not provide any benefit to the microorganisms. The fortuitous reaction is called a cometabolism or cooxidation. The fortuitous reaction is most commonly carried out by an oxygenase enzyme that is produced by the microorganisms in order to allow them to degrade some other compound. | ||
| Line 36: | Line 36: | ||
[[File:Wilson 3 Fig1.png|thumbnail|450 px|right|Figure 1. Degradation chlorinated alkenes to ethane.]] | [[File:Wilson 3 Fig1.png|thumbnail|450 px|right|Figure 1. Degradation chlorinated alkenes to ethane.]] | ||
| − | In anaerobic groundwater, when conditions are favorable, chlorinated alkenes can undergo a sequential reductive dehalogenation where a chlorine atom is replaced with a hydrogen atom. Degradation proceeds from PCE to TCE, then to DCE, then to VC and finally to ethene (Fig. 1). The minimal geochemical conditions<ref>Wiedemeier, T.H., Swanson, M.A., Moutoux, D.E., Gordon, E.K., Wilson, J.T., Wilson, B.H., Kampbell, D.H., Haas, P.E., Hansen, J.E., Chapelle, F.H., 1998. Technical protocol for evaluating natural attenuation of chlorinated solvents in ground water. EPA-600-R-98-128. [ | + | In anaerobic groundwater, when conditions are favorable, chlorinated alkenes can undergo a sequential reductive dehalogenation where a chlorine atom is replaced with a hydrogen atom. Degradation proceeds from PCE to TCE, then to DCE, then to VC and finally to ethene (Fig. 1). The minimal geochemical conditions<ref>Wiedemeier, T.H., Swanson, M.A., Moutoux, D.E., Gordon, E.K., Wilson, J.T., Wilson, B.H., Kampbell, D.H., Haas, P.E., Hansen, J.E., Chapelle, F.H., 1998. Technical protocol for evaluating natural attenuation of chlorinated solvents in ground water. EPA-600-R-98-128. [http://www.environmentalrestoration.wiki/images/2/27/Wiedemeier-1998-Technical_Protocol_for_Evaluating_Natuaral_Attenuation.pdf Report pdf]</ref> that must be taken into account include pH, oxidation-reduction potential (ORP), dissolved oxygen (DO) concentration, total organic carbon (TOC) and competing electron acceptors including oxygen, nitrate, sulfate and ferric iron. |
PCE and TCE can be used as an electron acceptor by a wide variety of bacteria<ref>Nyer, E.K., Payne, F., Sutherson, S., 2003. Discussion of environment vs. bacteria or let's play,‘name that bacteria’. Groundwater Monitoring & Remediation, 23(2), 32-48. [http://dx.doi.org/10.1111/j.1745-6592.2003.tb00665.x doi: 10.1111/j.1745-6592.2003.tb00665.x]</ref>. The bacteria can degrade PCE or TCE as far as DCE. The only organisms that can degrade DCE to VC and then degrade VC to the harmless end product ethane are stains of ''Dehalococcoides mccartyi''<ref>Löffler, F.E., Ritalahti, K.M., Zinder, S.H., 2013. Dehalococcoides and reductive dechlorination of chlorinated solvents. Bioaugmentation for groundwater remediation, ed. H.F. Stroo, Leeson, A., Ward, C.H. Springer, New York, NY. pgs. 39-88. ISBN: 978-1-4614-4114-4 ISBN 978-1-4614-4115-1. [http://dx.doi.org/10.1007/978-1-4614-4115-1 doi: 10.1007/978-1-4614-4115-1]</ref>. | PCE and TCE can be used as an electron acceptor by a wide variety of bacteria<ref>Nyer, E.K., Payne, F., Sutherson, S., 2003. Discussion of environment vs. bacteria or let's play,‘name that bacteria’. Groundwater Monitoring & Remediation, 23(2), 32-48. [http://dx.doi.org/10.1111/j.1745-6592.2003.tb00665.x doi: 10.1111/j.1745-6592.2003.tb00665.x]</ref>. The bacteria can degrade PCE or TCE as far as DCE. The only organisms that can degrade DCE to VC and then degrade VC to the harmless end product ethane are stains of ''Dehalococcoides mccartyi''<ref>Löffler, F.E., Ritalahti, K.M., Zinder, S.H., 2013. Dehalococcoides and reductive dechlorination of chlorinated solvents. Bioaugmentation for groundwater remediation, ed. H.F. Stroo, Leeson, A., Ward, C.H. Springer, New York, NY. pgs. 39-88. ISBN: 978-1-4614-4114-4 ISBN 978-1-4614-4115-1. [http://dx.doi.org/10.1007/978-1-4614-4115-1 doi: 10.1007/978-1-4614-4115-1]</ref>. | ||
| Line 62: | Line 62: | ||
The U.S. EPA regulates the maximum concentration of contaminants that are allowed in water that is supplied as drinking water. These U.S. EPA regulations are referred to as the Maximum Contaminant Level<ref>U.S. Environmental Protection Agency, 2016. Table of Regulated Drinking Water Contaminants. [http://www.epa.gov/your-drinking-water/table-regulated-drinking-water-contaminants Table of Regulated Drinking Water]</ref> or MCL. There are MCLs for the transformation products of reductive dechlorination (the DCEs and VC) and these products will be included in the target list of analytes in any conventional monitoring program. The products of dichloroelimination do not have MCLs and are not usually on the target list of analytes for conventional monitoring. | The U.S. EPA regulates the maximum concentration of contaminants that are allowed in water that is supplied as drinking water. These U.S. EPA regulations are referred to as the Maximum Contaminant Level<ref>U.S. Environmental Protection Agency, 2016. Table of Regulated Drinking Water Contaminants. [http://www.epa.gov/your-drinking-water/table-regulated-drinking-water-contaminants Table of Regulated Drinking Water]</ref> or MCL. There are MCLs for the transformation products of reductive dechlorination (the DCEs and VC) and these products will be included in the target list of analytes in any conventional monitoring program. The products of dichloroelimination do not have MCLs and are not usually on the target list of analytes for conventional monitoring. | ||
| − | If the major pathway of abiotic degradation is dichloroelimination, then conventional monitoring will fail to recognize the contribution of abiotic degradation on iron sulfide minerals. However, the stable isotopes of carbon in chlorinated solvents are strongly fractionated during abiotic degradation on iron sulfide minerals. [[Compound Specific Isotope Analysis (CSIA) | Compound Specific Isotope Analysis (CSIA)]]<ref>Hunkeler, D., Meckenstock, R. U., Sherwood Lollar, B., Schmidt, T.C., Wilson, J.T., 2008. A Guide for Assessing Biodegradation and Source Identification of Organic Groundwater Contaminants Using Compound Specific Isotope Analysis (CSIA). U.S. Environmental Protection Agency, Washington, D.C., EPA/600/R-08/148. [ | + | If the major pathway of abiotic degradation is dichloroelimination, then conventional monitoring will fail to recognize the contribution of abiotic degradation on iron sulfide minerals. However, the stable isotopes of carbon in chlorinated solvents are strongly fractionated during abiotic degradation on iron sulfide minerals. [[Compound Specific Isotope Analysis (CSIA) | Compound Specific Isotope Analysis (CSIA)]]<ref>Hunkeler, D., Meckenstock, R. U., Sherwood Lollar, B., Schmidt, T.C., Wilson, J.T., 2008. A Guide for Assessing Biodegradation and Source Identification of Organic Groundwater Contaminants Using Compound Specific Isotope Analysis (CSIA). U.S. Environmental Protection Agency, Washington, D.C., EPA/600/R-08/148. [http://www.environmentalrestoration.wiki/images/a/a9/Hunkeler-2008-A_Guide.pdf Report pdf]</ref> can be a useful tool to recognize abiotic degradation of chlorinated alkenes on iron sulfide minerals. |
| − | Magnetite is often present in unconsolidated glacial aquifers and aquifers that form in sediments that are shed by uplands composed of granite or other igneous rocks. Magnetite reacts readily with the chlorinated alkenes. The actual chemical interactions on magnetite are not well understood (Fig. 4). The ultimate degradation products are oxidized organic compounds and carbon dioxide<ref>Darlington, R., Rectanus, H., 2015. Biogeochemical Transformation Handbook. TR-NAVFAC EXWC-EV-1601, 41 pgs. [ | + | Magnetite is often present in unconsolidated glacial aquifers and aquifers that form in sediments that are shed by uplands composed of granite or other igneous rocks. Magnetite reacts readily with the chlorinated alkenes. The actual chemical interactions on magnetite are not well understood (Fig. 4). The ultimate degradation products are oxidized organic compounds and carbon dioxide<ref>Darlington, R., Rectanus, H., 2015. Biogeochemical Transformation Handbook. TR-NAVFAC EXWC-EV-1601, 41 pgs. [http://www.environmentalrestoration.wiki/images/7/78/Darlington-2015-Biogeochem_Transformation_Handbook.pdf Report pdf]</ref>. |
[[File:Wilson 3 Fig4.png|thumbnail|300 px|left|Figure 4. Degradation of chlorinated alkenes carried out by magnetite.]] | [[File:Wilson 3 Fig4.png|thumbnail|300 px|left|Figure 4. Degradation of chlorinated alkenes carried out by magnetite.]] | ||
| Line 75: | Line 75: | ||
==Tools and Databases for Chlorinated Solvent MNA== | ==Tools and Databases for Chlorinated Solvent MNA== | ||
| − | The Scenarios Evaluation Tool for Chlorinated Solvent MNA<ref>Truex, M.J., Newell, C.J., Looney, B.B, Vangelas, K., 2006. Scenarios evaluation tool for chlorinated solvent MNA. Savannah River National Laboratory, Aiken, South Carolina. WSRC-STI-2006-0096. [ | + | The Scenarios Evaluation Tool for Chlorinated Solvent MNA<ref>Truex, M.J., Newell, C.J., Looney, B.B, Vangelas, K., 2006. Scenarios evaluation tool for chlorinated solvent MNA. Savannah River National Laboratory, Aiken, South Carolina. WSRC-STI-2006-0096. [http://www.environmentalrestoration.wiki/images/2/27/Truex-2006-Scenarios_Evaluation_Tool_for_Chlorinated_Solvent_MNA.pdf Report pdf]</ref> was designed to provide a structure where the MNA methods and decision logic are linked together in one of 13 different “scenarios” or site types. Based on site data (e.g. Table 2), one selects which of the 13 scenarios best fits their site or portion of a site. Then one goes to the description of that scenario to learn which attenuation reactions are likely to be active, how to design a MNA monitoring program, whether MNA will work, and other relevant factors. |
[[File:Wilson 3 Table2.png|thumbnail|600 px|center|Table 2. Key elements of the scenarios tool for chlorinated solvent MNA.]] | [[File:Wilson 3 Table2.png|thumbnail|600 px|center|Table 2. Key elements of the scenarios tool for chlorinated solvent MNA.]] | ||
| − | A data mining study of MNA at 45 chlorinated solvent sites<ref>McGuire, T.M., Newell, C.J., Looney, B.B., Vangelas, K.M., 2003. Historical and retrospective survey of monitored natural attenuation: A line of inquiry supporting monitored natural attenuation and enhanced passive remediation of chlorinated solvents. Westinghouse Savannah River Company, Aiken, SC. [ | + | A data mining study of MNA at 45 chlorinated solvent sites<ref>McGuire, T.M., Newell, C.J., Looney, B.B., Vangelas, K.M., 2003. Historical and retrospective survey of monitored natural attenuation: A line of inquiry supporting monitored natural attenuation and enhanced passive remediation of chlorinated solvents. Westinghouse Savannah River Company, Aiken, SC. [http://www.environmentalrestoration.wiki/images/d/db/McGuire-2003-Historical_and_Retrospective_Survey_of_MNA.pdf Report pdf]</ref> provides some interesting information about plume sources, strength, and size (Fig. 6). |
[[File:Wilson 3 Fig6.png|thumbnail|500 px|center|Figure 6. Plume characteristics evaluation of 45 chlorinated solvent sites.]] | [[File:Wilson 3 Fig6.png|thumbnail|500 px|center|Figure 6. Plume characteristics evaluation of 45 chlorinated solvent sites.]] | ||
| Line 88: | Line 88: | ||
One study evaluated the change in source concentration over time at 23 chlorinated solvent sites by calculating concentration vs. time decay rates for source zone wells<ref>Newell, C.J., Cowie, I., McGuire, T.M., McNab Jr, W.W., 2006. Multiyear temporal changes in chlorinated solvent concentrations at 23 monitored natural attenuation sites. Journal of Environmental Engineering, American Society of Environmental Engineers, 132(6), 653-663. [http://dx.doi.org/10.1061/(asce)0733-9372(2006)132:6(653) doi: 10.1061/(asce)0733-9372(2006)132:6(653)]</ref>. The authors concluded, “If the median point decay rates from these sites are maintained over a 20 year period, the resulting reduction in concentration will be similar to the reported reduction in source zone concentrations achieved by active in situ source remediation technologies (typical project length: 1–2 years)". | One study evaluated the change in source concentration over time at 23 chlorinated solvent sites by calculating concentration vs. time decay rates for source zone wells<ref>Newell, C.J., Cowie, I., McGuire, T.M., McNab Jr, W.W., 2006. Multiyear temporal changes in chlorinated solvent concentrations at 23 monitored natural attenuation sites. Journal of Environmental Engineering, American Society of Environmental Engineers, 132(6), 653-663. [http://dx.doi.org/10.1061/(asce)0733-9372(2006)132:6(653) doi: 10.1061/(asce)0733-9372(2006)132:6(653)]</ref>. The authors concluded, “If the median point decay rates from these sites are maintained over a 20 year period, the resulting reduction in concentration will be similar to the reported reduction in source zone concentrations achieved by active in situ source remediation technologies (typical project length: 1–2 years)". | ||
| − | As part of the development process for the chlorinated solvent natural attenuation model<ref>Aziz, C.E., Smith, A.P., Newell, C.J., Gonzales, J.R., 2000. BIOCHLOR Chlorinated solvent plume database report. Air Force Center for Environmental Excellence, Texas. [ | + | As part of the development process for the chlorinated solvent natural attenuation model<ref>Aziz, C.E., Smith, A.P., Newell, C.J., Gonzales, J.R., 2000. BIOCHLOR Chlorinated solvent plume database report. Air Force Center for Environmental Excellence, Texas. [http://www.environmentalrestoration.wiki/images/d/de/Aziz-2000-BIOCHLOR-plume-database.pdf Report pdf]</ref> BIOCHLOR, 24 chlorinated solvent plumes were studied in detail. Key findings included: |
*TCE and c-DCE had median plume lengths of 1215 ft and 1205 ft, respectively. | *TCE and c-DCE had median plume lengths of 1215 ft and 1205 ft, respectively. | ||
| Line 104: | Line 104: | ||
==See Also== | ==See Also== | ||
| − | *[ | + | *[http://www.environmentalrestoration.wiki/images/3/37/EPA-MNA-Chlorinated-Organics-Symposium.pdf Proceedings of the Symposium on Natural Attenuation of Chlorinated Organics in Ground Water] |
| − | *[ | + | *[http://www.environmentalrestoration.wiki/images/6/66/AFCEE-Natural_Attenuation-Chlorinated_Solvents-1999.pdf Natural Attenuation of Chlorinated Solvents Performance and Cost Results From Multiple Air Force Demonstration Sites] |
*[https://www.serdp-estcp.org/Program-Areas/Environmental-Restoration/Contaminated-Groundwater/Monitoring/ER-1348 Using Advanced Analysis Approaches to Complete Long-Term Evaluations of Natural Attenuation Processes on the Remediation of Dissolved Chlorinated Solvent Contamination] | *[https://www.serdp-estcp.org/Program-Areas/Environmental-Restoration/Contaminated-Groundwater/Monitoring/ER-1348 Using Advanced Analysis Approaches to Complete Long-Term Evaluations of Natural Attenuation Processes on the Remediation of Dissolved Chlorinated Solvent Contamination] | ||
*[https://www.serdp-estcp.org/Program-Areas/Environmental-Restoration/Contaminated-Groundwater/Monitoring/ER-1349/ER-1349 Integrated Protocol for Assessment of Long-Term Sustainability of Monitored Natural Attenuation of Chlorinated Solvent Plumes] | *[https://www.serdp-estcp.org/Program-Areas/Environmental-Restoration/Contaminated-Groundwater/Monitoring/ER-1349/ER-1349 Integrated Protocol for Assessment of Long-Term Sustainability of Monitored Natural Attenuation of Chlorinated Solvent Plumes] | ||
Revision as of 12:48, 3 May 2018
Monitored Natural Attenuation (MNA) is a common remedy for contamination of chlorinated solvents in groundwater. Chlorinated solvents are susceptible to many natural processes that can attenuate their concentrations in groundwater including biological degradation, abiotic degradation, sorption, dispersion, and volatilization. Typically, MNA is used for plumes with low dissolved concentrations or in peripheral areas of plumes away from areas with non-aqueous phase liquid (NAPL) or other materials that serve as the source of groundwater contamination.
Related Article(s):
- Monitored Natural Attenuation (MNA)
- Monitored Natural Attenuation (MNA) of Fuels
- Monitored Natural Attenuation (MNA) of Metal and Metalloids
- Chlorinated Solvents
- Natural Source Zone Depletion (NSZD)
CONTRIBUTOR(S): Dr. John Wilson
Key Resource(s):
- Identification & Characterization Methods for Reactive Minerals Responsible for Natural Attenuation of Chlorinated Organic Compounds in Ground Water[1]
Introduction
Chlorinated solvents and their transformation products are among the most abundant contaminants in groundwater. In 2006, the United States Geological Survey published results from a systematic survey of volatile organic chemicals in drinking water wells[2] in the USA. Approximately 12% of wells contained detectable concentrations of tetrachloromethane ( chloroform), 5% contained tetrachloroethene (PCE), 4% contained trichloroethene (TCE), 2% contained 1,1,1-trichloroethane (1,1,1-TCA), and 2% contained 1,1-dichloroethane (1,1-DCA).
Monitored Natural Attenuation (MNA) is one remedy that is available for contamination from chlorinated solvents in groundwater. Natural processes that can attenuate the concentrations of chlorinated solvents in groundwater include biological degradation, abiotic degradation, sorption, dispersion into ground adjacent to the contaminant plume, and volatilization to soil gas above the groundwater. At most sites where MNA has been selected as a remedy, or part of a remedy, the chlorinated solvents have been shown to be degrading in groundwater.
Biodegradation
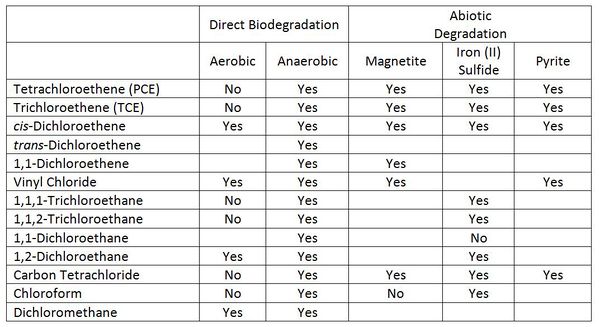
The prospects for degradation of selected chlorinated solvents and their transformation products in groundwater are good (Table 1).
Biodegradation can occur under both aerobic and anaerobic conditions. Under aerobic conditions, the chlorinated solvent can act as a source of food for the microorganisms (referred to as direct biodegradation in Table 1). Degradation can also be a fortuitous reaction that does not provide any benefit to the microorganisms. The fortuitous reaction is called a cometabolism or cooxidation. The fortuitous reaction is most commonly carried out by an oxygenase enzyme that is produced by the microorganisms in order to allow them to degrade some other compound.
When the chlorinated solvent is degraded as a food source, the population of active organisms and the rate of degradation will increase over time. If the degradation is fortuitous, the bacteria do not grow as a result of degrading the chlorinated solvent, and the rate constant does not increase over time.
The prospects for direct aerobic biodegradation of chlorinated alkenes depends on the extent of chlorination. PCE and TCE do not support growth under aerobic conditions, cis-dichloroethene[4] (c-DCE) can be degraded in aerobic groundwater, and vinyl chloride (VC) is readily degradable in many aerobic groundwaters.
Many samples of groundwater contain microorganisms that express oxygenase enzymes and can cometabolize PCE, TCE or dichloroethene (DCE)[5]. However, the specific contribution of these organisms to MNA is not well understood[6], and studies are trying to define their contribution[7].
Under anaerobic conditions, the chlorinated solvents act as an electron acceptor. In such cases, electron donors may be in the form of naturally occurring, bioavailable organic carbon, or possibly from comingled plumes of petroleum hydrocarbons. The chlorinated solvents function in bacterial metabolism in the same fashion as oxygen functions in human metabolism. The chlorinated solvents are essentially something for the bacteria to breath in the absence of other electron acceptors such as oxygen, nitrate, or sulfate.
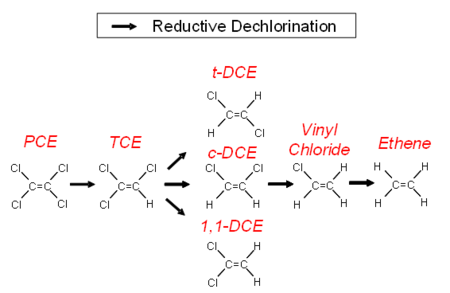
In anaerobic groundwater, when conditions are favorable, chlorinated alkenes can undergo a sequential reductive dehalogenation where a chlorine atom is replaced with a hydrogen atom. Degradation proceeds from PCE to TCE, then to DCE, then to VC and finally to ethene (Fig. 1). The minimal geochemical conditions[8] that must be taken into account include pH, oxidation-reduction potential (ORP), dissolved oxygen (DO) concentration, total organic carbon (TOC) and competing electron acceptors including oxygen, nitrate, sulfate and ferric iron.
PCE and TCE can be used as an electron acceptor by a wide variety of bacteria[9]. The bacteria can degrade PCE or TCE as far as DCE. The only organisms that can degrade DCE to VC and then degrade VC to the harmless end product ethane are stains of Dehalococcoides mccartyi[10].
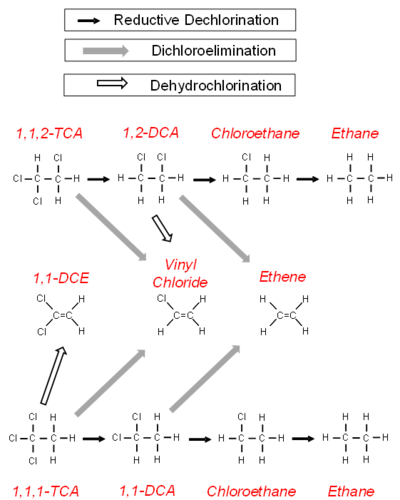
The degradation of chlorinated alkanes in anaerobic groundwater is more complicated (Fig. 2). Chlorinated alkanes can undergo a sequential reductive dehalogenation. In addition, they can undergo the loss of a hydrogen and a chlorine atom to form an alkene (a dehydrochlorination) or the loss of two chlorine atoms to form an alkene (a dichloroelimination).
Three reactions have been demonstrated for 1,1,1-TCA in groundwater (Fig. 2)[11]. It can undergo an abiotic hydrolysis reaction to produce acetate, an abiotic dehydrochlorination to produce 1,1-DCE, and a biological reductive dechlorination reaction to 1,1-DCA and then chloroethane. In addition to being reduced to chloroethane, 1,1-DCA can undergo a dichloroelimination reaction[12] to produce ethene.
The degradation of 1,1,2-TCA follows a similar pattern (Fig. 2). One strain of Desulfitobacterium has been shown to dechlorinate 1,1,2-TCA to 1,2-DCA and chloroethane[13] through a sequential reductive dehalogenation. Certain strains of Dehalogenimonas go through a dichloroelimination reaction[14] to dechlorinate 1,1,2-TCA to VC and 1,2-DCA to ethene. A strain of Dehalobacter can also dechlorinate 1,2-DCA to ethene[15].
A quantitative framework (BioPIC)[16] is now available that allows an evaluation of the rate constant for anaerobic biological degradation of cDCE and VC based on the abundance of gene markers for Dehalococcoides mccartyi. The relationships between the rate constants for degradation of the chlorinated alkanes and abundance of gene copies of Dehalobacter, Dehalogenimonas and other active bacteria are still being explored.
Abiotic Degradation
Chlorinated solvents can chemically react with a number of iron minerals in aquifers[1]. The most important of these are magnetite, iron mono-sulfide, and pyrite.
Iron sulfide minerals form as a consequence of sulfate reduction in groundwater. The sulfide produced from sulfate reduction will react with Iron (III) minerals to form iron mono-sulfide. Over time the iron mono-sulfide will react with excess sulfide to produce pyrite.
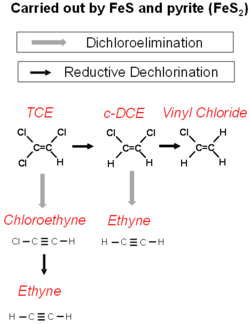
The reactions of the chlorinated alkanes with the iron sulfide minerals is a sequential reductive dechlorination. However, the reaction of iron sulfide minerals with chlorinated alkenes is more complex (Fig. 3). Reductive dechlorination and dichloroelimination can proceed at the same time.
The U.S. EPA regulates the maximum concentration of contaminants that are allowed in water that is supplied as drinking water. These U.S. EPA regulations are referred to as the Maximum Contaminant Level[17] or MCL. There are MCLs for the transformation products of reductive dechlorination (the DCEs and VC) and these products will be included in the target list of analytes in any conventional monitoring program. The products of dichloroelimination do not have MCLs and are not usually on the target list of analytes for conventional monitoring.
If the major pathway of abiotic degradation is dichloroelimination, then conventional monitoring will fail to recognize the contribution of abiotic degradation on iron sulfide minerals. However, the stable isotopes of carbon in chlorinated solvents are strongly fractionated during abiotic degradation on iron sulfide minerals. Compound Specific Isotope Analysis (CSIA)[18] can be a useful tool to recognize abiotic degradation of chlorinated alkenes on iron sulfide minerals.
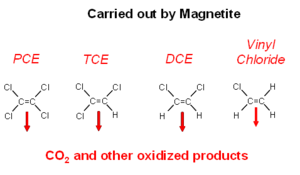
Magnetite is often present in unconsolidated glacial aquifers and aquifers that form in sediments that are shed by uplands composed of granite or other igneous rocks. Magnetite reacts readily with the chlorinated alkenes. The actual chemical interactions on magnetite are not well understood (Fig. 4). The ultimate degradation products are oxidized organic compounds and carbon dioxide[19].
Footprints
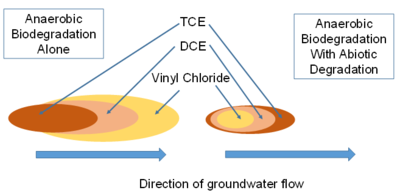
Most plumes have some contribution of anaerobic sequential reductive dechlorination. As a result, the primary contaminant and the transformation products of reductive dechlorination are present in the groundwater. The highest concentrations of the primary contaminant will be near the source of contamination, and the flow of groundwater carries the transformation products further downgradient from the source (Fig. 5).
Many plumes of chlorinated solvents also have a contribution of abiotic degradation. As a result, the intermediate degradation products (such as DCE) do not accumulate to stoichiometric concentrations. There is an appearance that degradation of the cDCE has stalled, when in fact it is actively degrading, but not to vinyl chloride (Fig. 5). A quantitative framework[16] is now available that allows an evaluation of the contribution of abiotic degradation on magnetite based on the magnetic susceptibility of the sediment, and the contribution of abiotic degradation on pyrite based on the extent of sulfate reduction and the geochemistry of the groundwater.
Tools and Databases for Chlorinated Solvent MNA
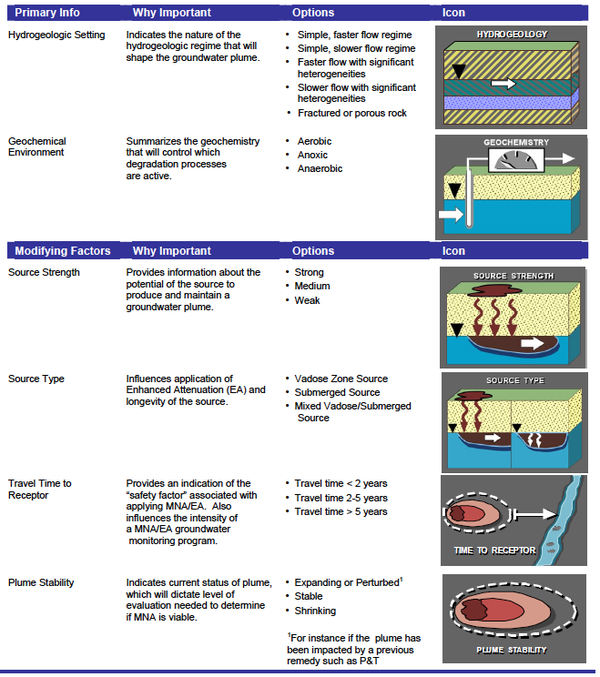
The Scenarios Evaluation Tool for Chlorinated Solvent MNA[20] was designed to provide a structure where the MNA methods and decision logic are linked together in one of 13 different “scenarios” or site types. Based on site data (e.g. Table 2), one selects which of the 13 scenarios best fits their site or portion of a site. Then one goes to the description of that scenario to learn which attenuation reactions are likely to be active, how to design a MNA monitoring program, whether MNA will work, and other relevant factors.
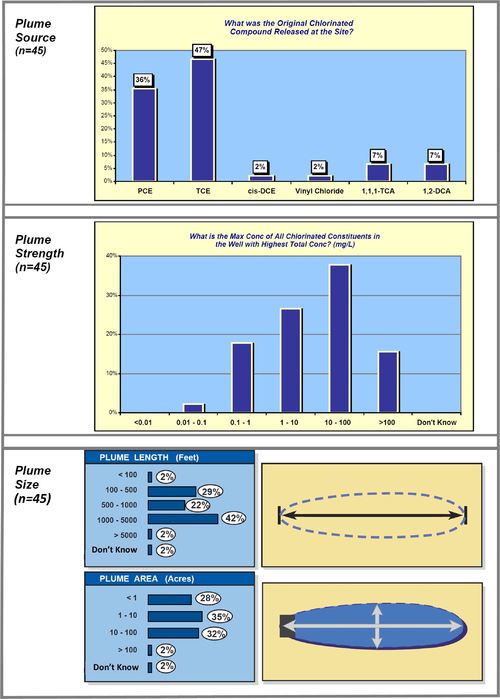
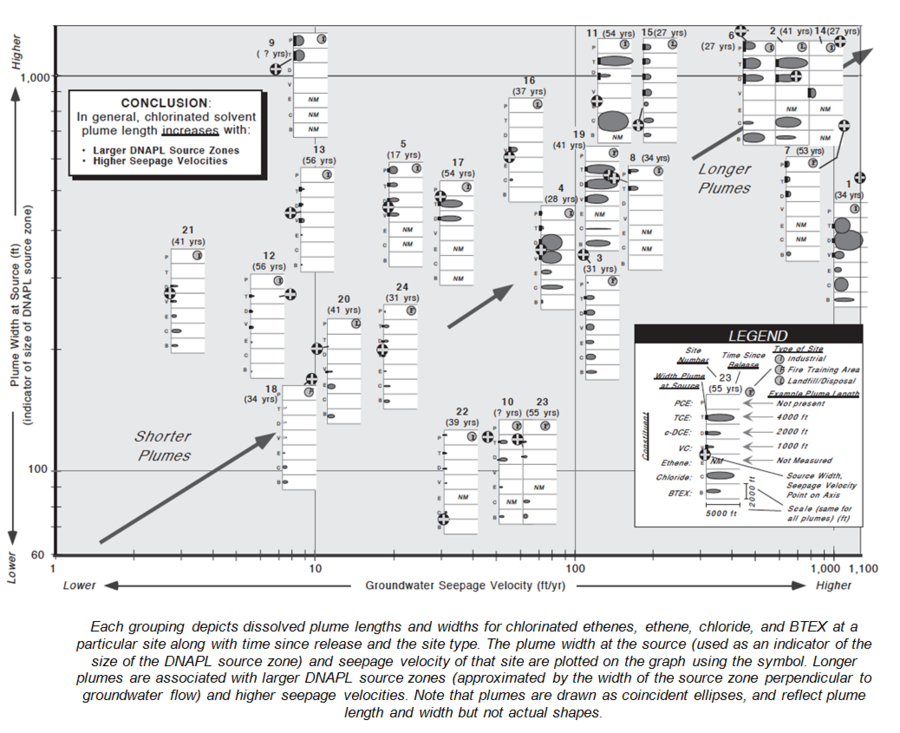
A data mining study of MNA at 45 chlorinated solvent sites[21] provides some interesting information about plume sources, strength, and size (Fig. 6).
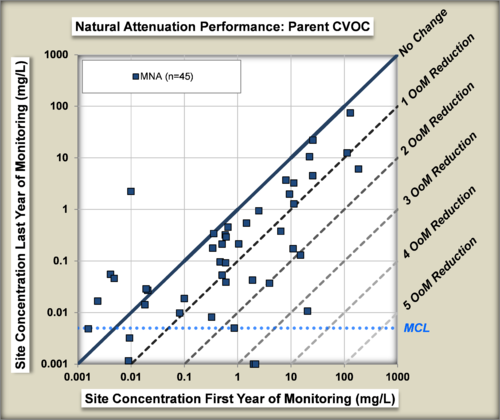
The performance of MNA was evaluated[22] by comparing the change in concentrations of chlorinated organic compounds in wells in the source zone of plumes from the beginning to the end of an MNA monitoring period (Fig. 7).
One study evaluated the change in source concentration over time at 23 chlorinated solvent sites by calculating concentration vs. time decay rates for source zone wells[23]. The authors concluded, “If the median point decay rates from these sites are maintained over a 20 year period, the resulting reduction in concentration will be similar to the reported reduction in source zone concentrations achieved by active in situ source remediation technologies (typical project length: 1–2 years)".
As part of the development process for the chlorinated solvent natural attenuation model[24] BIOCHLOR, 24 chlorinated solvent plumes were studied in detail. Key findings included:
- TCE and c-DCE had median plume lengths of 1215 ft and 1205 ft, respectively.
- Chlorinated ethene plume lengths were moderately correlated with seepage velocity and source width (Fig. 8).
- First order decay rates ranged between 1 and 2 per year for the chlorinated ethane plumes.
Summary
MNA is an important remediation technology at some chlorinated solvent sites. There are numerous reactions, both biotic and abiotic, that can act on different chlorinated solvent compounds. Several tools and databases are available to help understand how chlorinated solvent plumes behave and to design and implement appropriate MNA programs.
References
- ^ 1.0 1.1 1.2 He, Y., Su, C., Wilson, J., Wilkin, R., Adair, C., Lee, T., Bradley, P. and Ferrey, M., 2009. Identification and characterization methods for reactive minerals responsible for natural attenuation of chlorinated organic compounds in ground water. U.S. Environmental Protection Agency. Report pdf
- ^ Zogorski, J.S., Carter, J.M., Ivahnenko, T., Lapham, W.W., Moran, M.J., Rowe, B.L., Squillace, P.J., Toccalino, P.L., 2006. The quality of our Nation’s waters - Volatile organic compounds in the nation’s ground water and drinking-water supply wells. US Geological Survey Circular, 1292, 101. Report pdf
- ^ Lawrence, S.J., 2006. Description, properties, and degradation of selected volatile organic compounds detected in ground water--A review of selected literature (No. 2006-1338). Report pdf
- ^ Cox, E., 2012. Elucidation of the mechanisms and environmental relevance of cis-dichloroethene and vinyl chloride biodegradation. ER-1557. ER-1557
- ^ ITRC. 2011. Enzyme Activity Probes EMD Team Fact Sheet. Fact Sheet
- ^ Looney, B., 2010. Incorporating Aerobic Processes into Remedies for Large Chlorinated Solvent Plumes. ER-201026. ER-201026
- ^ Wiedemeier, T.H., 2015. Providing Additional Support for MNA by Including Quantitative Lines of Evidence for Abiotic Degradation and Cometabolic Oxidation of Chlorinated Ethylenes. ER-201584. ER-201584
- ^ Wiedemeier, T.H., Swanson, M.A., Moutoux, D.E., Gordon, E.K., Wilson, J.T., Wilson, B.H., Kampbell, D.H., Haas, P.E., Hansen, J.E., Chapelle, F.H., 1998. Technical protocol for evaluating natural attenuation of chlorinated solvents in ground water. EPA-600-R-98-128. Report pdf
- ^ Nyer, E.K., Payne, F., Sutherson, S., 2003. Discussion of environment vs. bacteria or let's play,‘name that bacteria’. Groundwater Monitoring & Remediation, 23(2), 32-48. doi: 10.1111/j.1745-6592.2003.tb00665.x
- ^ Löffler, F.E., Ritalahti, K.M., Zinder, S.H., 2013. Dehalococcoides and reductive dechlorination of chlorinated solvents. Bioaugmentation for groundwater remediation, ed. H.F. Stroo, Leeson, A., Ward, C.H. Springer, New York, NY. pgs. 39-88. ISBN: 978-1-4614-4114-4 ISBN 978-1-4614-4115-1. doi: 10.1007/978-1-4614-4115-1
- ^ Scheutz, C., Durant, N.D., Hansen, M.H., Bjerg, P.L., 2011. Natural and enhanced anaerobic degradation of 1,1,1-trichloroethane and its degradation products in the subsurface–a critical review. Water Research, 45(9), 2701-2723. doi:10.1016/j.watres.2011.02.027
- ^ Lollar, B.S., Hirschorn, S., Mundle, S.O., Grostern, A., Edwards, E.A., Lacrampe-Couloume, G., 2010. Insights into enzyme kinetics of chloroethane biodegradation using compound specific stable isotopes. Environmental Science & Technology, 44(19), 7498-7503. doi: 10.1021/es101330r
- ^ Zhao, S., Ding, C., He, J., 2015. Detoxification of 1,1,2-trichloroethane to ethene by desulfitobacterium and identification of its functional reductase gene. PloS One, 10(4), p.e0119507. doi:10.1371/journal.pone.0119507
- ^ Bowman, K.S., Nobre, M.F., da Costa, M.S., Rainey, F.A. and Moe, W.M., 2013. Dehalogenimonas alkenigignens sp. nov., a chlorinated-alkane-dehalogenating bacterium isolated from groundwater. International Journal of Systematic and Evolutionary Microbiology, 63(4), 1492-1498. doi: 10.1099/ijs.0.045054-0
- ^ Grostern, A., Edwards, E.A., 2009. Characterization of a Dehalobacter coculture that dechlorinates 1,2-dichloroethane to ethene and identification of the putative reductive dehalogenase gene. Applied and Environmental Microbiology, 75(9), 2684-2693. doi: 10.1128/AEM.02037-08
- ^ 16.0 16.1 Lebron, C. A., Wiedemeier, T. H., Wilson, J.T., Löffler, F.E., Hinchee, R.E., Singletary, M.A., 2015. Development and Validation of a Quantitative Framework and Management Expectation Tool for the Selection of Bioremediation Approaches at Chlorinated Solvent Sites. ER-201129. ER-201129
- ^ U.S. Environmental Protection Agency, 2016. Table of Regulated Drinking Water Contaminants. Table of Regulated Drinking Water
- ^ Hunkeler, D., Meckenstock, R. U., Sherwood Lollar, B., Schmidt, T.C., Wilson, J.T., 2008. A Guide for Assessing Biodegradation and Source Identification of Organic Groundwater Contaminants Using Compound Specific Isotope Analysis (CSIA). U.S. Environmental Protection Agency, Washington, D.C., EPA/600/R-08/148. Report pdf
- ^ Darlington, R., Rectanus, H., 2015. Biogeochemical Transformation Handbook. TR-NAVFAC EXWC-EV-1601, 41 pgs. Report pdf
- ^ Truex, M.J., Newell, C.J., Looney, B.B, Vangelas, K., 2006. Scenarios evaluation tool for chlorinated solvent MNA. Savannah River National Laboratory, Aiken, South Carolina. WSRC-STI-2006-0096. Report pdf
- ^ McGuire, T.M., Newell, C.J., Looney, B.B., Vangelas, K.M., 2003. Historical and retrospective survey of monitored natural attenuation: A line of inquiry supporting monitored natural attenuation and enhanced passive remediation of chlorinated solvents. Westinghouse Savannah River Company, Aiken, SC. Report pdf
- ^ McGuire, T., 2016. Development of an Expanded, High-Reliability Cost and Performance Database for In-Situ Remediation Technologies. ESTCP Project No. ER-201120. ER-201120
- ^ Newell, C.J., Cowie, I., McGuire, T.M., McNab Jr, W.W., 2006. Multiyear temporal changes in chlorinated solvent concentrations at 23 monitored natural attenuation sites. Journal of Environmental Engineering, American Society of Environmental Engineers, 132(6), 653-663. doi: 10.1061/(asce)0733-9372(2006)132:6(653)
- ^ Aziz, C.E., Smith, A.P., Newell, C.J., Gonzales, J.R., 2000. BIOCHLOR Chlorinated solvent plume database report. Air Force Center for Environmental Excellence, Texas. Report pdf
See Also
- Proceedings of the Symposium on Natural Attenuation of Chlorinated Organics in Ground Water
- Natural Attenuation of Chlorinated Solvents Performance and Cost Results From Multiple Air Force Demonstration Sites
- Using Advanced Analysis Approaches to Complete Long-Term Evaluations of Natural Attenuation Processes on the Remediation of Dissolved Chlorinated Solvent Contamination
- Integrated Protocol for Assessment of Long-Term Sustainability of Monitored Natural Attenuation of Chlorinated Solvent Plumes
- Impact of Landfill Closure Designs on Long-Term Natural Attenuation of Chlorinated Hydrocarbons
- Estimating Cleanup Times Associated with Combining Source-Area Remediation with Monitored Natural Attenuation
- Use of Enzyme Probes for Estimation of Trichloroethene Degradation Rates and Acceptance of Monitored Natural Attenuation
- Verification of Methods for Assessing the Sustainability of Monitored Natural Attenuation
- Development and Validation of a Quantitative Framework and Management Expectation Tool for the Selection of Bioremediation Approaches at Chlorinated Solvent Sites
- Frequently Asked Questions about Monitored Natural Attenuation in the 21st Century
- Online Lecture Course - Abiotic Degradation
