|
|
| (529 intermediate revisions by the same user not shown) |
| Line 1: |
Line 1: |
| − | ==Assessing Vapor Intrusion (VI) Impacts in Neighborhoods with Groundwater Contaminated by Chlorinated Volatile Organic Chemicals (CVOCs)== | + | ==Estimating PCE/TCE Abiotic First-Order Reductive Dechlorination Rate Constants in Clayey Soils Under Anoxic Conditions== |
| − | The VI Diagnosis Toolkit<ref name="JohnsonEtAl2020">Johnson, P.C., Guo, Y., Dahlen, P., 2020. The VI Diagnosis Toolkit for Assessing Vapor Intrusion Pathways and Mitigating Impacts in Neighborhoods Overlying Dissolved Chlorinated Solvent Plumes. ESTCP Project ER-201501, Final Report. [https://serdp-estcp.mil/projects/details/a0d8bafd-c158-4742-b9fe-5f03d002af71 Project Website] [[Media: ER-201501.pdf | Final Report.pdf]]</ref> is a set of tools that can be used individually or in combination to assess vapor intrusion (VI) impacts at one or more buildings overlying regional-scale dissolved chlorinated solvent-impacted groundwater plumes. The strategic use of these tools can lead to confident and efficient neighborhood-scale VI pathway assessments. | + | The U.S. Department of Defense (DoD) faces many challenges in restoring aquifers at contaminated sites, often due to back-diffusion of tetrachloroethene (PCE) and trichloroethene (TCE) from low-permeability clay zones. The uptake, storage, and subsequent long-term release of these dissolved contaminants from clays are key processes in understanding the longevity, intensity, and risks associated with many persistent chlorinated ethene groundwater plumes. Although naturally occurring abiotic and biotic dechlorination processes in clays may reduce stored contaminant mass and significantly aid natural attenuation, no standardized field method currently exists to verify or quantify these reactions. It is critical to remediation design efforts to demonstrate and validate a cost-effective in situ approach for assessing these dechlorination processes using first-order rate constants. An approach was developed and applied across eight DoD sites to support Remedial Project Managers (RPMs) and regulators in evaluating natural attenuation potential in clay-rich environments. |
| − | | |
| | <div style="float:right;margin:0 0 2em 2em;">__TOC__</div> | | <div style="float:right;margin:0 0 2em 2em;">__TOC__</div> |
| | | | |
| | '''Related Article(s):''' | | '''Related Article(s):''' |
| | | | |
| − | *[[Vapor Intrusion (VI)]] | + | *[[Monitored Natural Attenuation (MNA)]] |
| − | *[[Vapor Intrusion – Sewers and Utility Tunnels as Preferential Pathways]] | + | *[[Monitored Natural Attenuation (MNA) of Chlorinated Solvents]] |
| − | | + | *[[Monitored Natural Attenuation - Transitioning from Active Remedies]] |
| − | '''Contributor(s):'''
| + | *[[Matrix Diffusion]] |
| − | | + | *[[REMChlor - MD]] |
| − | *Paul C. Johnson, Ph.D. | |
| − | *Paul Dahlen, Ph.D. | |
| − | *Yuanming Guo, Ph.D. | |
| − | | |
| − | '''Key Resource(s):'''
| |
| | | | |
| − | *The VI Diagnosis Toolkit for Assessing Vapor Intrusion Pathways and Impacts in Neighborhoods Overlying Dissolved Chlorinated Solvent Plumes, ESTCP Project ER-201501, Final Report<ref name="JohnsonEtAl2020"/>
| + | '''Contributors:''' Dani Tran, Dr. Charles Schaefer, Dr. Charles Werth |
| | | | |
| − | *CPM Test Guidelines: Use of Controlled Pressure Method Testing for Vapor Intrusion Pathway Assessment, ESTCP Project ER-201501, Technical Report<ref name="JohnsonEtAl2021">Johnson, P.C., Guo, Y., Dahlen, P., 2021. CPM Test Guidelines: Use of Controlled Pressure Method Testing for Vapor Intrusion Pathway Assessment. ESTCP ER-201501, Technical Report. [https://serdp-estcp.mil/projects/details/a0d8bafd-c158-4742-b9fe-5f03d002af71 Project Website] [[Media: ER-201501_Technical_Report.pdf | Technical_Report.pdf]]</ref> | + | '''Key Resource:''' |
| − | | + | *Schaefer, C.E, Tran, D., Nguyen, D., Latta, D.E., Werth, C.J., 2025. Evaluating Mineral and In Situ Indicators of Abiotic Dechlorination in Clayey Soils<ref name="SchaeferEtAl2025"/> |
| − | *VI Diagnosis Toolkit User Guide, ESTCP Project ER-201501<ref name="JohnsonEtAl2022">Johnson, P.C., Guo, Y., and Dahlen, P., 2022. VI Diagnosis Toolkit User Guide, ESTCP ER-201501, User Guide. [https://serdp-estcp.mil/projects/details/a0d8bafd-c158-4742-b9fe-5f03d002af71 Project Website] [[Media: ER-201501_User_Guide.pdf | User_Guide.pdf]]</ref>
| |
| | | | |
| | ==Introduction== | | ==Introduction== |
| − | Most federal, state, and local regulatory guidance for assessing and mitigating the [[Vapor Intrusion (VI) | vapor intrusion]] pathway reflects USEPA’s ''Technical Guide for Assessing and Mitigating the Vapor Intrusion Pathway from Subsurface Vapor Sources to Indoor Air''<ref name="USEPA2015">USEPA, 2015. OSWER Technical Guide for Assessing and Mitigating the Vapor Intrusion Pathway from Subsurface Vapor Sources to Indoor Air. U.S. Environmental Protection Agency, Office of Solid Waste and Emergency Response, OSWER Publication No. 9200.2-154, 267 pages. [https://www.epa.gov/vaporintrusion/technical-guide-assessing-and-mitigating-vapor-intrusion-pathway-subsurface-vapor USEPA Website] [[Media: USEPA2015.pdf | Report.pdf]]</ref>. The paradigm outlined by that guidance includes: 1) a preliminary and mostly qualitative analysis that looks for site conditions that suggest vapor intrusion might occur (e.g., the presence of vapor-forming chemicals in close proximity to buildings); 2) a multi-step and more detailed quantitative screening analysis that involves site-specific data collection and their comparison to screening levels to identify buildings of potential VI concern; and 3) selection and design of mitigation systems or continued monitoring, as needed. With respect to (2), regulatory guidance typically recommends consideration of “multiple lines of evidence” in decision-making<ref name="USEPA2015"/><ref>NJDEP, 2021. Vapor Intrusion Technical Guidance, Version 5.0. New Jersey Department of Environmental Protection, Trenton, NJ. [https://dep.nj.gov/srp/guidance/vapor-intrusion/vig/ Website] [[Media: NJDEP2021.pdf | Guidance Document.pdf]]</ref>, with typical lines-of-evidence being groundwater, soil gas, sub-slab soil gas, and/or indoor air concentrations. Of those, soil gas measurements and/or measured short-term indoor air concentrations can be weighted heavily, and therefore decision making might not be completed without them. Effective evaluation of VI risk from sub-slab and/or soil gas measurements would require an unknown building-specific attenuation factor, but there is also uncertainty as to whether or not indoor air data is representative of maximum and/or long-term average indoor concentrations. Indoor air data can be confounded by indoor contaminant sources because the number of samples is typically small, indoor concentrations can vary with time, and because a number of household products can emit the chemicals being measured. When conducting VI pathway assessments in neighborhoods where it is impractical to assess all buildings, the EPA recommends following a “worst first” investigational approach.
| + | Cost-effective methods are needed to verify the occurrence of natural dechlorination processes and quantify their dechlorination rates in clays under ambient in situ conditions in order to reliably predict their long-term influence on plume longevity and mass discharge. However, accurately determining these rates is challenging due to slow reaction kinetics, the transient nature of transformation products, and the interplay of biotic and abiotic mechanisms within the clay matrix or at clay-sand interfaces. Tools capable of quantifying these reactions and assessing their role in mitigating plume persistence would be a significant aid for long-term site management. |
| − | | |
| − | The limitations of this approach, as practiced, are the following:
| |
| − | *Decisions are rarely made without indoor air data and generally, seasonal sampling is required, delaying decision-making.
| |
| − | *The collection of a robust indoor air data set that adequately characterizes long-term indoor air concentrations could take years given the typical frequency of data collection and the most common methods of sample collection (e.g., 24-hour samples). Therefore, indoor air sampling might continue indefinitely at some sites.
| |
| − | *The “worst first” buildings might not be identified correctly by the logic outlined in USEPA’s 2015 guidance and the most impacted buildings might not even be located over a groundwater plume. Recent studies have shown [[Vapor Intrusion – Sewers and Utility Tunnels as Preferential Pathways |VI impacts in homes as a result of sewer and other subsurface piping connections]], which are not explicitly considered nor easily characterized through conventional VI pathway assessment<ref> Beckley, L, McHugh, T., 2020. A Conceptual Model for Vapor Intrusion from Groundwater Through Sewer Lines. Science of the Total Environment, 698, Article 134283. [https://doi.org/10.1016/j.scitotenv.2019.134283 doi: 10.1016/j.scitotenv.2019.134283] [[Media: BeckleyMcHugh2020.pdf | Open Access Article]]</ref><ref name="GuoEtAl2015">Guo, Y., Holton, C., Luo, H., Dahlen, P., Gorder, K., Dettenmaier, E., Johnson, P.C., 2015. Identification of Alternative Vapor Intrusion Pathways Using Controlled Pressure Testing, Soil Gas Monitoring, and Screening Model Calculations. Environmental Science and Technology, 49(22), pp. 13472–13482. [https://doi.org/10.1021/acs.est.5b03564 doi: 10.1021/acs.est.5b03564]</ref><ref name="McHughEtAl2017">McHugh, T., Beckley, L., Sullivan, T., Lutes, C., Truesdale, R., Uppencamp, R., Cosky, B., Zimmerman, J., Schumacher, B., 2017. Evidence of a Sewer Vapor Transport Pathway at the USEPA Vapor Intrusion Research Duplex. Science of the Total Environment, pp. 598, 772-779. [https://doi.org/10.1016/j.scitotenv.2017.04.135 doi: 10.1016/j.scitotenv.2017.04.135] [[Media: McHughEtAl2017.pdf | Open Access Manuscipt]]</ref><ref name="McHughBeckley2018">McHugh, T., Beckley, L., 2018. Sewers and Utility Tunnels as Preferential Pathways for Volatile Organic Compound Migration into Buildings: Risk Factors and Investigation Protocol. ESTCP ER-201505, Final Report. [https://serdp-estcp.mil/projects/details/f12abf80-5273-4220-b09a-e239d0188421 Project Website] [[Media: ER-201505.pdf | Final Report.pdf]]</ref><ref name="RiisEtAl2010">Riis, C., Hansen, M.H., Nielsen, H.H., Christensen, A.G., Terkelsen, M., 2010. Vapor Intrusion through Sewer Systems: Migration Pathways of Chlorinated Solvents from Groundwater to Indoor Air. Seventh International Conference on Remediation of Chlorinated and Recalcitrant Compounds, May, Monterey, CA. Battelle Memorial Institute. ISBN 978-0-9819730-2-9. [https://www.battelle.org/conferences/battelle-conference-proceedings Website] [[Media: RiisEtAl2010.pdf | Report.pdf]]</ref>.
| |
| − | *The presumptive remedy for VI mitigation (sub-slab depressurization) may not be effective for all VI scenarios (e.g., those involving vapor migration to indoor spaces via sewer connections).
| |
| − |
| |
| − | The '''VI Diagnosis Toolkit''' components were developed considering these limitations as well as more recent knowledge gained through research, development, and validation projects funded by SERDP and ESTCP.
| |
| − | | |
| − | ==The VI Diagnosis Toolkit Components==
| |
| − | The primary components of the VI Diagnosis Toolkit and their uses include:
| |
| − | *'''External VI source strength screening''' to identify buildings most likely to be impacted by VI at levels warranting building-specific testing.
| |
| − | *'''Indoor air source screening''' to locate and remove indoor air sources that might confound building specific VI pathway assessment.
| |
| − | *'''Controlled pressurization method (CPM)''' testing to quickly (in a few days or less) measure the worst-case indoor air impact likely to be caused by VI under natural conditions in specific buildings. CPM tests can also be used to identify the presence of indoor air sources and diagnose active VI pathways.
| |
| − | *'''Passive indoor sampling''' for determining long-term average indoor air concentrations under natural VI conditions and/or for verifying mitigation system effectiveness in buildings that warrant VI mitigation.
| |
| − | *'''Comprehensive VI conceptual model development and refinement''' to ensure that appropriate monitoring, investigation, and mitigation strategies are being selected.
| |
| − | | |
| − | Expanded discussions for each of these are given below.
| |
| − | | |
| − | '''External VI source strength screening''' identifies those buildings that warrant more intrusive building-specific assessments, using data collected exterior to the buildings. The use of groundwater and/or soil gas concentration data for building screening has been part of VI pathway assessments for some time and their use is discussed in many regulatory guidance documents. Typically, the measured concentrations are compared to relevant screening levels derived via modeling or empirical analyses from indoor air concentrations of concern.
| |
| − | | |
| − | More recently it has been discovered that VI impacts can occur via sewer and other subsurface piping connections in areas where vapor migration through the soil would not be expected to be significant, and this could also occur in buildings that do not sit over contaminated groundwater
| |
| − | | |
| − | | |
| − | [[File:ChangFig2.png | thumb | 400px| Figure 1. Example of instrumentation used for OPTICS monitoring.]]
| |
| − | [[File:ChangFig1.png | thumb | 400px| Figure 2. Schematic diagram illustrating the OPTICS methodology. High resolution in-situ data are integrated with traditional discrete sample analytical data using partial least-square regression to derive high resolution chemical contaminant concentration data series.]]
| |
| − | Nationwide, the liability due to contaminated sediments is estimated in the trillions of dollars. Stakeholders are assessing and developing remedial strategies for contaminated sediment sites in major harbors and waterways throughout the U.S. The mobility of contaminants in surface water is a primary transport and risk mechanism<ref>Thibodeaux, L.J., 1996. Environmental Chemodynamics: Movement of Chemicals in Air, Water, and Soil, 2nd Edition, Volume 110 of Environmental Science and Technology: A Wiley-Interscience Series of Texts and Monographs. John Wiley & Sons, Inc. 624 pages. ISBN: 0-471-61295-2</ref><ref>United States Environmental Protection Agency (USEPA), 2005. Contaminated Sediment Remediation Guidance for Hazardous Waste Sites. Office of Superfund Remediation and Technology Innovation Report, EPA-540-R-05-012. [[Media: 2005-USEPA-Contaminated_Sediment_Remediation_Guidance.pdf | Report.pdf]]</ref><ref>Lick, W., 2008. Sediment and Contaminant Transport in Surface Waters. CRC Press. 416 pages. [https://doi.org/10.1201/9781420059885 doi: 10.1201/9781420059885]</ref>; therefore, long-term monitoring of both particulate- and dissolved-phase contaminant concentration prior to, during, and following remedial action is necessary to document remedy effectiveness. Source control and total maximum daily load (TMDL) actions generally require costly manual monitoring of dissolved and particulate contaminant concentrations in surface water. The magnitude of cost for these actions is a strong motivation to implement efficient methods for long-term source control and remedial monitoring.
| |
| | | | |
| − | Traditional surface water monitoring requires mobilization of field teams to manually collect discrete water samples, send samples to laboratories, and await laboratory analysis so that a site evaluation can be conducted. These traditional methods are well known to have inherent cost and safety concerns and are of limited use (due to safety concerns and standby requirements for resources) in capturing the effects of episodic events (e.g., storms) that are important to consider in site risk assessment and remedy selection. Automated water samplers are commercially available but still require significant field support and costly laboratory analysis. Further, automated samplers may not be suitable for analytes with short hold-times and temperature requirements.
| + | For reductive abiotic dechlorination under anoxic conditions, a 1% hydrochloric acid (HCl) extraction of a sample of native clay coupled with X-ray diffraction (XRD) data can be used as a screening level tool to estimate reductive dechlorination rate constants. These rate constants can be inserted into fate and transport models such as [[REMChlor - MD]]<ref>Falta, R., and Wang, W., 2017. A semi-analytical method for simulating matrix diffusion in numerical transport models. Journal of Contaminant Hydrology, 197, pp. 39-49. [https://doi.org/10.1016/j.jconhyd.2016.12.007 doi: 10.1016/j.jconhyd.2016.12.007] [[Media: FaltaWang2017.pdf | Open Access Manuscript]]</ref><ref>Kulkarni, P.R., Adamson, D.T., Popovic, J., Newell, C.J., 2022. Modeling a well-charactized perfluorooctane sulfate (PFOS) source and plume using the REMChlor-MD model to account for matrix diffusion. Journal of Contaminant Hydrology, 247, Article 103986. [https://doi.org/10.1016/j.jconhyd.2022.103986 doi: 10.1016/j.jconhyd.2022.103986] [[Media: KulkarniEtAl2022.pdf | Open Access Manuscript]]</ref> to quantify abiotic dechlorination impacts within clay aquitards on chlorinated solvent plumes. Thus, determination of the abiotic reductive dechlorination rate constant for a particular clayey soil can be readily utilized to provide a more accurate assessment of aquifer cleanup timeframes for groundwater plumes that are being sustained by contaminant back-diffusion. |
| | | | |
| − | Optically-based characterization of surface water contaminants is a cost-effective alternative to traditional discrete water sampling methods. Unlike discrete water sampling, which typically results in sparse data at low resolution, and therefore, is of limited use in determining mass loading, OPTICS (OPTically-based In-situ Characterization System) provides continuous data and allows for a complete understanding of water quality and contaminant transport in response to natural processes and human impacts<ref name="ChangEtAl2019"/><ref name="ChangEtAl2018"/><ref name="ChangEtAl2024"/><ref>Bergamaschi, B.A., Fleck, J.A., Downing, B.D., Boss, E., Pellerin, B., Ganju, N.K., Schoellhamer, D.H., Byington, A.A., Heim, W.A., Stephenson, M., Fujii, R., 2011. Methyl mercury dynamics in a tidal wetland quantified using in situ optical measurements. Limnology and Oceanography, 56(4), pp. 1355-1371. [https://doi.org/10.4319/lo.2011.56.4.1355 doi: 10.4319/lo.2011.56.4.1355] [[Media: BergamaschiEtAl2011.pdf | Open Access Article]]</ref><ref>Bergamaschi, B.A., Fleck, J.A., Downing, B.D., Boss, E., Pellerin, B.A., Ganju, N.K., Schoellhamer, D.H., Byington, A.A., Heim, W.A., Stephenson, M., Fujii, R., 2012. Mercury Dynamics in a San Francisco Estuary Tidal Wetland: Assessing Dynamics Using In Situ Measurements. Estuaries and Coasts, 35, pp. 1036-1048. [https://doi.org/10.1007/s12237-012-9501-3 doi: 10.1007/s12237-012-9501-3] [[Media: BergamaschiEtAl2012a.pdf | Open Access Article]]</ref><ref>Bergamaschi, B.A., Krabbenhoft, D.P., Aiken, G.R., Patino, E., Rumbold, D.G., Orem, W.H., 2012. Tidally driven export of dissolved organic carbon, total mercury, and methylmercury from a mangrove-dominated estuary. Environmental Science and Technology, 46(3), pp. 1371-1378. [https://doi.org/10.1021/es2029137 doi: 10.1021/es2029137] [[Media: BergamaschiEtAl2012b.pdf | Open Access Article]]</ref>. The OPTICS tool integrates commercial off-the-shelf ''in situ'' aquatic sensors (Figure 1), periodic discrete surface water sample collection, and a multi-parameter statistical prediction model<ref name="deJong1993">de Jong, S., 1993. SIMPLS: an alternative approach to partial least squares regression. Chemometrics and Intelligent Laboratory Systems, 18(3), pp. 251-263. [https://doi.org/10.1016/0169-7439(93)85002-X doi: 10.1016/0169-7439(93)85002-X]</ref><ref name="RosipalKramer2006">Rosipal, R. and Krämer, N., 2006. Overview and Recent Advances in Partial Least Squares, In: Subspace, Latent Structure, and Feature Selection: Statistical and Optimization Perspectives Workshop, Revised Selected Papers (Lecture Notes in Computer Science, Volume 3940), Springer-Verlag, Berlin, Germany. pp. 34-51. [https://doi.org/10.1007/11752790_2 doi: 10.1007/11752790_2]</ref> to provide high temporal and/or spatial resolution characterization of surface water chemicals of potential concern (COPCs) (Figure 2).
| + | ==Recommended Approach== |
| | + | [[File: TranFig1.png | thumb | 500 px | Figure 1: First-order rate constants for abiotic reductive dechlorination of TCE under anaerobic conditions. Circles are data from Schaefer ''et al.'', 2021<ref>Schaefer, C.E., Ho, P., Berns, E., Werth, C., 2021. Abiotic dechlorination in the presence of ferrous minerals. Journal of Contaminant Hydrology, 241, 103839. [https://doi.org/10.1016/j.jconhyd.2021.103839 doi: 10.1016/j.jconhyd.2021.103839] [[Media: SchaeferEtAl2021.pdf | Open Access Manuscript]]</ref>, filled squares from Schaefer ''et al.'', 2018<ref name="SchaeferEtAl2018"/>, and Schaefer ''et al.'', 2017<ref>Schaefer, C.E., Ho., Gurr, C., Berns, E., Werth, C., 2017. Abiotic dechlorination of chlorinated ethenes in natural clayey soils: impacts of mineralogy and temperature. Journal of Contaminant Hydrology, 206, pp. 10-17. [https://doi.org/10.1016/j.jconhyd.2017.09.007 doi: 10.1016/j.jconhyd.2017.09.007] [[Media: SchaeferEtAl2017.pdf | Open Access Manuscript]]</ref>, and open squares from Schaefer ''et al.'', 2025<ref name="SchaeferEtAl2025"/>. ]] |
| | + | [[File: TranFig2.png | thumb | 600 px | Figure 2: Flowchart diagram of field screening procedures]] |
| | + | The recommended approach builds upon the methodology and findings of a recent study<ref name="SchaeferEtAl2025">Schaefer, C.E., Tran, D., Nguyen, D., Latta, D.E., Werth, C.J., 2025. Evaluating Mineral and In Situ Indicators of Abiotic Dechlorination in Clayey Soils. Groundwater Monitoring and Remediation, 45(2), pp. 31-39. [https://doi.org/10.1111/gwmr.12709 doi: 10.1111/gwmr.12709]</ref>, emphasizing field-based and analytical techniques to quantify abiotic first-order reductive dechlorination rate constants for PCE and TCE in clayey soils under anoxic conditions. Key components of this evaluation are listed below: |
| | + | #<u>Zone Identification:</u> The focus of the investigation should be to delineate clayey zones adjacent to hydraulically conductive zones. |
| | + | #<u>Ferrous Mineral Quantification:</u> Assess ferrous mineral context in clay via 1% HCl extraction at ambient temperature over a 10-minute interval. |
| | + | #<u>Mineralogical Characterization:</u> Conduct XRD analysis with the specific intent of identifying the presence of pyrite and biotite. |
| | + | #<u>Reduced Gas Analysis:</u> Measurement of reduced gases such as acetylene, ethene, and ethane concentrations in clay samples. Gas-tight sampling devices (e.g., En Core® soil samplers by En Novative Technologies, Inc.) should be used to ensure sample integrity during collection and transport. |
| | | | |
| − | ==Technology Overview==
| + | Clay samples should be collected within a few centimeters of the high-permeability interface, with optional additional sampling further inward. For mineralogical analysis, a defined interval may be collected and subsequently subsampled. To preserve sample integrity, exposure to air should be minimized during collection, transport, and handling. Homogenization should occur within an anaerobic chamber, and if subsamples are required for external analysis, they must be shipped in gas-tight, anaerobic containers. |
| − | The principle behind OPTICS is based on the relationship between optical properties of natural waters and the particles and dissolved material contained within them<ref>Boss, E. and Pegau, W.S., 2001. Relationship of light scattering at an angle in the backward direction to the backscattering coefficient. Applied Optics, 40(30), pp. 5503-5507. [https://doi.org/10.1364/AO.40.005503 doi: 10.1364/AO.40.005503]</ref><ref>Boss, E., Twardowski, M.S., Herring, S., 2001. Shape of the particulate beam spectrum and its inversion to obtain the shape of the particle size distribution. Applied Optics, 40(27), pp. 4884-4893. [https://doi.org/10.1364/AO.40.004885 doi:10/1364/AO.40.004885]</ref><ref>Babin, M., Morel, A., Fournier-Sicre, V., Fell, F., Stramski, D., 2003. Light scattering properties of marine particles in coastal and open ocean waters as related to the particle mass concentration. Limnology and Oceanography, 48(2), pp. 843-859. [https://doi.org/10.4319/lo.2003.48.2.0843 doi: 10.4319/lo.2003.48.2.0843] [[Media: BabinEtAl2003.pdf | Open Access Article]]</ref><ref>Coble, P., Hu, C., Gould, R., Chang, G., Wood, M., 2004. Colored dissolved organic matter in the coastal ocean: An optical tool for coastal zone environmental assessment and management. Oceanography, 17(2), pp. 50-59. [https://doi.org/10.5670/oceanog.2004.47 doi: 10.5670/oceanog.2004.47] [[Media: CobleEtAl2004.pdf | Open Access Article]]</ref><ref>Sullivan, J.M., Twardowski, M.S., Donaghay, P.L., Freeman, S.A., 2005. Use of optical scattering to discriminate particle types in coastal waters. Applied Optics, 44(9), pp. 1667–1680. [https://doi.org/10.1364/AO.44.001667 doi: 10.1364/AO.44.001667]</ref><ref>Twardowski, M.S., Boss, E., Macdonald, J.B., Pegau, W.S., Barnard, A.H., Zaneveld, J.R.V., 2001. A model for estimating bulk refractive index from the optical backscattering ratio and the implications for understanding particle composition in case I and case II waters. Journal of Geophysical Research: Oceans, 106(C7), pp. 14,129-14,142. [https://doi.org/10.1029/2000JC000404 doi: 10/1029/2000JC000404] [[Media: TwardowskiEtAl2001.pdf | Open Access Article]]</ref><ref>Chang, G.C., Barnard, A.H., McLean, S., Egli, P.J., Moore, C., Zaneveld, J.R.V., Dickey, T.D., Hanson, A., 2006. In situ optical variability and relationships in the Santa Barbara Channel: implications for remote sensing. Applied Optics, 45(15), pp. 3593–3604. [https://doi.org/10.1364/AO.45.003593 doi: 10.1364/AO.45.003593]</ref><ref>Slade, W.H. and Boss, E., 2015. Spectral attenuation and backscattering as indicators of average particle size. Applied Optics, 54(24), pp. 7264-7277. [https://doi.org/10.1364/AO.54.007264 doi: 10/1364/AO.54.007264] [[Media: SladeBoss2015.pdf | Open Access Article]]</ref>. Surface water COPCs such as heavy metals and polychlorinated biphenyls (PCBs) are hydrophobic in nature and tend to sorb to materials in the water column, which have unique optical signatures that can be measured at high-resolution using ''in situ'', commercially available aquatic sensors<ref>Agrawal, Y.C. and Pottsmith, H.C., 2000. Instruments for particle size and settling velocity observations in sediment transport. Marine Geology, 168(1-4), pp. 89-114. [https://doi.org/10.1016/S0025-3227(00)00044-X doi: 10.1016/S0025-3227(00)00044-X]</ref><ref>Boss, E., Pegau, W.S., Gardner, W.D., Zaneveld, J.R.V., Barnard, A.H., Twardowski, M.S., Chang, G.C., Dickey, T.D., 2001. Spectral particulate attenuation and particle size distribution in the bottom boundary layer of a continental shelf. Journal of Geophysical Research: Oceans, 106(C5), pp. 9509-9516. [https://doi.org/10.1029/2000JC900077 doi: 10.1029/2000JC900077] [[Media: BossEtAl2001.pdf | Open Access Article]]</ref><ref>Boss, E., Pegau, W.S., Lee, M., Twardowski, M., Shybanov, E., Korotaev, G. Baratange, F., 2004. Particulate backscattering ratio at LEO 15 and its use to study particle composition and distribution. Journal of Geophysical Research: Oceans, 109(C1), Article C01014. [https://doi.org/10.1029/2002JC001514 doi: 10.1029/2002JC001514] [[Media: BossEtAl2004.pdf | Open Access Article]]</ref><ref>Briggs, N.T., Slade, W.H., Boss, E., Perry, M.J., 2013. Method for estimating mean particle size from high-frequency fluctuations in beam attenuation or scattering measurement. Applied Optics, 52(27), pp. 6710-6725. [https://doi.org/10.1364/AO.52.006710 doi: 10.1364/AO.52.006710] [[Media: BriggsEtAl2013.pdf | Open Access Article]]</ref>. Therefore, high-resolution concentrations of COPCs can be accurately and robustly derived from ''in situ'' measurements using statistical methods.
| |
| | | | |
| − | The OPTICS method is analogous to the commonly used empirical derivation of total suspended solids concentration (TSS) from optical turbidity using linear regression<ref>Rasmussen, P.P., Gray, J.R., Glysson, G.D., Ziegler, A.C., 2009. Guidelines and procedures for computing time-series suspended-sediment concentrations and loads from in-stream turbidity-sensor and streamflow data. In: Techniques and Methods, Book 3: Applications of Hydraulics, Section C: Sediment and Erosion Techniques, Ch. 4. 52 pages. U.S. Geological Survey. [[Media: RasmussenEtAl2009.pdf | Open Access Article]]</ref>. However, rather than deriving one response variable (TSS) from one predictor variable (turbidity), OPTICS involves derivation of one response variable (e.g., PCB concentration) from a suite of predictor variables (e.g., turbidity, temperature, salinity, and fluorescence of chlorophyll-a) using multi-parameter statistical regression. OPTICS is based on statistical correlation – similar to the turbidity-to-TSS regression technique. The method does not rely on interpolation or extrapolation.
| + | Estimation of the abiotic reductive first-order rate constant for PCE and TCE is based on the “reactive” ferrous content in the clay. Reactive ferrous content (Fe(II)<sub>r</sub>) is estimated as shown in Equation 1: |
| | | | |
| − | The OPTICS technique utilizes partial least-squares (PLS) regression to determine a combination of physical, optical, and water quality properties that best predicts chemical contaminant concentrations with high variance. PLS regression is a statistically based method combining multiple linear regression and principal component analysis (PCA), where multiple linear regression finds a combination of predictors that best fit a response and PCA finds combinations of predictors with large variance<ref name="deJong1993"/><ref name="RosipalKramer2006"/>. Therefore, PLS identifies combinations of multi-collinear predictors (''in situ'', high-resolution physical, optical, and water quality measurements) that have large covariance with the response values (discrete surface water chemical contaminant concentration data from samples that are collected periodically, coincident with ''in situ'' measurements). PLS combines information about the variances of both the predictors and the responses, while also considering the correlations among them. PLS therefore provides a model with reliable predictive power.
| + | ::'''Equation 1:''' <big>''Fe(II)<sub><small>r</small></sub> = DA + XRD<sub><small>pyr</small></sub> - XRD<sub><small>biotite</small></sub>''</big> |
| | | | |
| − | OPTICS ''in situ'' measurement parameters include, but are not limited to current velocity, conductivity, temperature, depth, turbidity, dissolved oxygen, and fluorescence of chlorophyll-a and dissolved organic matter. Instrumentation for these measurements is commercially available, robust, deployable in a wide variety of configurations (e.g., moored, vessel-mounted, etc.), powered by batteries, and records data internally and/or transmits data in real-time. The physical, optical, and water quality instrumentation is compact and self-contained. The modularity and automated nature of the OPTICS measurement system enables robust, long-term, autonomous data collection for near-continuous monitoring.
| + | where ''DA'' is the ferrous content from the dilute acid (1% HCl) extraction, ''XRD<sub><small>pyr</small></sub>'' is the pyrite content from XRD analysis, and ''XRD<sub><small>biotite</small></sub>'' is the biotite content from XRD analysis<ref name="SchaeferEtAl2025"/>. |
| | | | |
| − | [[File:ChangFig3.png | thumb | 400px| Figure 3. OPTICS to characterize COPC variability in the context of site processes at BCSA. (A) Tidal oscillations (Elev.<sub>MSL</sub>) and precipitation (Precip.). (B) – (D) OPTICS-derived particulate mercury (PHg) and methylmercury (PMeHg) and total PCBs (TPCBs). Open circles represent discrete water sample data.]] OPTICS measurements are provided at a significantly reduced cost relative to traditional monitoring techniques used within the environmental industry. Cost performance analysis shows that monitoring costs are reduced by more than 85% while significantly increasing the temporal and spatial resolution of sampling. The reduced cost of monitoring makes this technology suitable for a number of environmental applications including, but not limited to site baseline characterization, source control evaluation, dredge or stormflow plume characterization, and remedy performance monitoring. OPTICS has been successfully demonstrated for characterizing a wide variety of COPCs: mercury, methylmercury, copper, lead, PCBs, dichlorodiphenyltrichloroethane (DDT) and its related compounds (collectively, DDX), and 2,3,7,8-Tetrachlorodibenzo-p-dioxin (TCDD or dioxin) in a number of different environmental systems ranging from inland lakes and rivers to the coastal ocean. To date, OPTICS has been limited to surface water applications. Additional applications (e.g., groundwater) would require further research and development.
| + | Abiotic dechlorination is unlikely to contribute to mitigating contaminant back-diffusion when reactive ferrous iron (Fe(II)<sub><small>r</small></sub>) concentrations are below 100 mg/kg (Figure 1). For Fe(II)<sub><small>r</small></sub> above 100 mg/kg, the first-order rate constant for PCE and TCE reductive dechlorination can be estimated using the correlation shown in Figure 1<ref name="SchaeferEtAl2018">Schaefer, C.E., Ho, P., Berns, E., Werth, C., 2018. Mechanisms for abiotic dechlorination of trichloroethene by ferrous minerals under oxic and anoxic conditions in natural sediments. Environmental Science and Technology, 52(23), pp.13747-13755. [https://doi.org/10.1021/acs.est.8b04108 doi: 10.1021/acs.est.8b04108]</ref><ref>Borden, R.C., Cha, K.Y., 2021. Evaluating the impact of back diffusion on groundwater cleanup time. Journal of Contaminant Hydrology, 243, Article 103889. [https://doi.org/10.1016/j.jconhyd.2021.103889 doi: 10.1016/j.jconhyd.2021] [[Media: BordenCha2021.pdf | Open Access Manuscript]]</ref>. The rate constant exhibits a strong positive correlation with the logarithm of reactive Fe(II) content (Pearson’s ''r'' = 0.82), with a slope of 4.7 × 10⁻⁸ L g⁻¹ d⁻¹ (log mg kg⁻¹)⁻¹. |
| | | | |
| − | ==Applications==
| + | Figure 2 presents a decision flowchart designed to evaluate the significance and extent of abiotic reductive dechlorination. By applying Equation 1 to the dilute acid extractable Fe(II) plus measured mineral species data from clay samples, the reactive ferrous iron content (Fe(II)<sub><small>r</small></sub>) can be quantified, enabling a streamlined assessment of the extent to which abiotic processes are contributing to the mitigation of contaminant back-diffusion. |
| − | [[File:ChangFig4.png | thumb | 400px| Figure 4. OPTICS reveals baseflow daily cycling and confirms storm-induced particle-bound COPC resuspension and mobilization through bank interaction. (A) Flow rate (Q) and precipitation (Precip). (B) – (C) OPTICS-derived particulate mercury (PHg) and methylmercury (PMeHg). Open circles represent discrete water sample data.]]
| |
| − | [[File:ChangFig5.png | thumb | 400px| Figure 5. Three-dimensional volume plot of high spatial resolution OPTICS-derived PCBs in exceedance of baseline showing that PCBs were discharged from the outfall (yellow arrow), remained in suspension, and dispersed elsewhere before settling.]]
| |
| − | An OPTICS study was conducted at Berry’s Creek Study Area (BCSA), New Jersey in 2014 and 2015 to understand COPC sources and transport mechanisms for development of an effective remediation plan. OPTICS successfully extended periodic discrete surface water samples to continuous, high-resolution measurements of PCBs, mercury, and methylmercury to elucidate COPC sources and transport throughout the BCSA tidal estuary system. OPTICS provided data at resolution sufficient to investigate COC variability in the context of physical processes. The results (Figure 3) facilitated focused and effective site remediation and management decisions that could not be determined based on periodic discrete samples alone, despite over seven years of monitoring at different locations throughout the system over a range of different seasons, tidal phases, and environmental conditions. The BCSA OPTICS methodology and its results have undergone official peer review overseen by the U.S. Environmental Protection Agency (USEPA), and those results have been published in peer-reviewed literature<ref name="ChangEtAl2019"/>.
| |
| | | | |
| − | OPTICS was applied at the South River, Virginia in 2016 to quantify sources of legacy mercury in the system that are contributing to recontamination and continued elevated mercury concentrations in fish tissue. OPTICS provided information necessary to identify mechanisms for COPC redistribution and to quantify the relative contribution of each mechanism to total mass transport of mercury and methylmercury in the system. Continuous, high-resolution COPC data afforded by OPTICS helped resolve baseflow daily cycling that had never before been observed at the South River (Figure 4) and provided data at temporal resolution necessary to verify storm-induced particle-bound COC resuspension and mobilization through bank interaction. The results informed source control and remedy design and monitoring efforts. Methodology and results from the South River have been published in peer-reviewed literature<ref name="ChangEtAl2018"/>.
| + | If Fe(II)r is ≥ 100 mg/kg, a first-order dechlorination rate constant can be estimated and subsequently used within a contaminant fate and transport model. However, if acetylene is detected in the clay, even with Fe(II)r less than 100 mg/kg, then bench-scale testing using methods similar to those described in a recent study<ref name="SchaeferEtAl2025"/> is recommended, as such results would likely be inconsistent with those shown in Figure 1, suggesting some other mechanism might be involved, or that the system mineralogy might be more complex than anticipated. Even if Fe(II)r ≥ 100 mg/kg, confirmatory bench-scale testing may be conducted for additional verification and to refine estimation of the abiotic dechlorination rate constant. |
| | | | |
| − | The U.S. Department of Defense’s Environmental Security Technology Certification Program (ESTCP) supported an OPTICS demonstration study at the Pearl Harbor Sediment Site, Hawaii, to determine whether stormwater from Oscar 1 Pier outfall is a contributing source of PCBs to Decision Unit (DU) N-2 (ESTCP Project ER21-5021). High spatial resolution results afforded by ship-based, mobile OPTICS monitoring suggested that PCBs were discharged from the outfall, remained in suspension, and dispersed elsewhere before settling (Figure 5). More details regarding this study were presented by Chang et al. in 2024<ref name="ChangEtAl2024"/>. | + | ==Summary and Recommendations== |
| | + | The approach outlined above is intended to serve as a generalized guide for practitioners and site managers to cost-effectively determine the extent to which beneficial abiotic reductive dechlorination reactions are likely occurring in low permeability (e.g., clayey) zones. This approach may be contraindicated if co-contaminants are present. It is currently unclear whether other classes of potentially reactive chemicals, such as trinitrotoluene (TNT) or chlorinated ethanes, could interact competitively with PCE and TCE. |
| | | | |
| − | ==Summary==
| + | In addition, it remains unclear how other classes of compounds such as per- and polyfluoroalkyl substances (PFAS) may interact or sorb with ferrous minerals and potentially inhibit abiotic dechlorination reactions. Coupling these recommended activities with conventional site investigation tasks would provide an opportunity to perform many of the up-front screening activities with minimal additional project costs. It is important to note that the guidance proposed herein pertains to particularly low permeability media. Sites with complex or varying lithology, where the mineralogy and/or redox conditions may vary, might require evaluation of multiple samples to provide appropriate site-wide information. |
| − | OPTICS provides:
| |
| − | *High resolution surface water chemical contaminant characterization
| |
| − | *Cost-effective monitoring and assessment
| |
| − | *Versatile and modular monitoring with capability for real-time telemetry
| |
| − | *Data necessary for development and validation of conceptual site models
| |
| − | *A key line of evidence for designing and evaluating remedies.
| |
| | | | |
| − | Because OPTICS monitoring involves deployment of autonomous sampling instrumentation, a substantially greater volume of data can be collected using this technique compared to traditional sampling, and at a far lower cost. A large volume of data supports evaluation of chemical contaminant concentrations over a range of spatial and temporal scales, and the system can be customized for a variety of environmental applications. OPTICS helps quantify contaminant mass flux and the relative contribution of local transport and source areas to net contaminant transport. OPTICS delivers a strong line of evidence for evaluating contaminant sources, fate, and transport, and for supporting the design of a remedy tailored to address site-specific, risk-driving conditions. The improved understanding of site processes aids in the development of mitigation measures that minimize site risks.
| + | <br clear="right"/> |
| | | | |
| | ==References== | | ==References== |
| Line 91: |
Line 55: |
| | | | |
| | ==See Also== | | ==See Also== |
| | + | *[https://serdp-estcp.mil/projects/details/a7e3f7b5-ed82-4591-adaa-6196ff33dd60 ESTCP Project ER20-5031 – In Situ Verification and Quantification of Naturally Occurring Dechlorination Rates in Clays: Demonstrating Processes that Mitigate Back-Diffusion and Plume Persistence] |
Estimating PCE/TCE Abiotic First-Order Reductive Dechlorination Rate Constants in Clayey Soils Under Anoxic Conditions
The U.S. Department of Defense (DoD) faces many challenges in restoring aquifers at contaminated sites, often due to back-diffusion of tetrachloroethene (PCE) and trichloroethene (TCE) from low-permeability clay zones. The uptake, storage, and subsequent long-term release of these dissolved contaminants from clays are key processes in understanding the longevity, intensity, and risks associated with many persistent chlorinated ethene groundwater plumes. Although naturally occurring abiotic and biotic dechlorination processes in clays may reduce stored contaminant mass and significantly aid natural attenuation, no standardized field method currently exists to verify or quantify these reactions. It is critical to remediation design efforts to demonstrate and validate a cost-effective in situ approach for assessing these dechlorination processes using first-order rate constants. An approach was developed and applied across eight DoD sites to support Remedial Project Managers (RPMs) and regulators in evaluating natural attenuation potential in clay-rich environments.
Related Article(s):
Contributors: Dani Tran, Dr. Charles Schaefer, Dr. Charles Werth
Key Resource:
- Schaefer, C.E, Tran, D., Nguyen, D., Latta, D.E., Werth, C.J., 2025. Evaluating Mineral and In Situ Indicators of Abiotic Dechlorination in Clayey Soils[1]
Introduction
Cost-effective methods are needed to verify the occurrence of natural dechlorination processes and quantify their dechlorination rates in clays under ambient in situ conditions in order to reliably predict their long-term influence on plume longevity and mass discharge. However, accurately determining these rates is challenging due to slow reaction kinetics, the transient nature of transformation products, and the interplay of biotic and abiotic mechanisms within the clay matrix or at clay-sand interfaces. Tools capable of quantifying these reactions and assessing their role in mitigating plume persistence would be a significant aid for long-term site management.
For reductive abiotic dechlorination under anoxic conditions, a 1% hydrochloric acid (HCl) extraction of a sample of native clay coupled with X-ray diffraction (XRD) data can be used as a screening level tool to estimate reductive dechlorination rate constants. These rate constants can be inserted into fate and transport models such as REMChlor - MD[2][3] to quantify abiotic dechlorination impacts within clay aquitards on chlorinated solvent plumes. Thus, determination of the abiotic reductive dechlorination rate constant for a particular clayey soil can be readily utilized to provide a more accurate assessment of aquifer cleanup timeframes for groundwater plumes that are being sustained by contaminant back-diffusion.
Recommended Approach
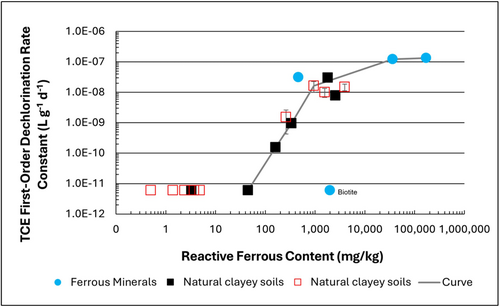
Figure 1: First-order rate constants for abiotic reductive dechlorination of TCE under anaerobic conditions. Circles are data from Schaefer
et al., 2021
[4], filled squares from Schaefer
et al., 2018
[5], and Schaefer
et al., 2017
[6], and open squares from Schaefer
et al., 2025
[1].
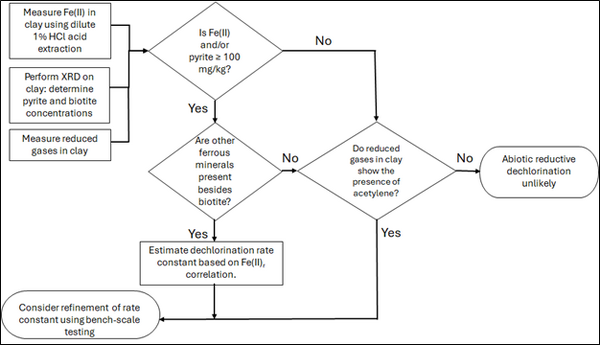
Figure 2: Flowchart diagram of field screening procedures
The recommended approach builds upon the methodology and findings of a recent study[1], emphasizing field-based and analytical techniques to quantify abiotic first-order reductive dechlorination rate constants for PCE and TCE in clayey soils under anoxic conditions. Key components of this evaluation are listed below:
- Zone Identification: The focus of the investigation should be to delineate clayey zones adjacent to hydraulically conductive zones.
- Ferrous Mineral Quantification: Assess ferrous mineral context in clay via 1% HCl extraction at ambient temperature over a 10-minute interval.
- Mineralogical Characterization: Conduct XRD analysis with the specific intent of identifying the presence of pyrite and biotite.
- Reduced Gas Analysis: Measurement of reduced gases such as acetylene, ethene, and ethane concentrations in clay samples. Gas-tight sampling devices (e.g., En Core® soil samplers by En Novative Technologies, Inc.) should be used to ensure sample integrity during collection and transport.
Clay samples should be collected within a few centimeters of the high-permeability interface, with optional additional sampling further inward. For mineralogical analysis, a defined interval may be collected and subsequently subsampled. To preserve sample integrity, exposure to air should be minimized during collection, transport, and handling. Homogenization should occur within an anaerobic chamber, and if subsamples are required for external analysis, they must be shipped in gas-tight, anaerobic containers.
Estimation of the abiotic reductive first-order rate constant for PCE and TCE is based on the “reactive” ferrous content in the clay. Reactive ferrous content (Fe(II)r) is estimated as shown in Equation 1:
- Equation 1: Fe(II)r = DA + XRDpyr - XRDbiotite
where DA is the ferrous content from the dilute acid (1% HCl) extraction, XRDpyr is the pyrite content from XRD analysis, and XRDbiotite is the biotite content from XRD analysis[1].
Abiotic dechlorination is unlikely to contribute to mitigating contaminant back-diffusion when reactive ferrous iron (Fe(II)r) concentrations are below 100 mg/kg (Figure 1). For Fe(II)r above 100 mg/kg, the first-order rate constant for PCE and TCE reductive dechlorination can be estimated using the correlation shown in Figure 1[5][7]. The rate constant exhibits a strong positive correlation with the logarithm of reactive Fe(II) content (Pearson’s r = 0.82), with a slope of 4.7 × 10⁻⁸ L g⁻¹ d⁻¹ (log mg kg⁻¹)⁻¹.
Figure 2 presents a decision flowchart designed to evaluate the significance and extent of abiotic reductive dechlorination. By applying Equation 1 to the dilute acid extractable Fe(II) plus measured mineral species data from clay samples, the reactive ferrous iron content (Fe(II)r) can be quantified, enabling a streamlined assessment of the extent to which abiotic processes are contributing to the mitigation of contaminant back-diffusion.
If Fe(II)r is ≥ 100 mg/kg, a first-order dechlorination rate constant can be estimated and subsequently used within a contaminant fate and transport model. However, if acetylene is detected in the clay, even with Fe(II)r less than 100 mg/kg, then bench-scale testing using methods similar to those described in a recent study[1] is recommended, as such results would likely be inconsistent with those shown in Figure 1, suggesting some other mechanism might be involved, or that the system mineralogy might be more complex than anticipated. Even if Fe(II)r ≥ 100 mg/kg, confirmatory bench-scale testing may be conducted for additional verification and to refine estimation of the abiotic dechlorination rate constant.
Summary and Recommendations
The approach outlined above is intended to serve as a generalized guide for practitioners and site managers to cost-effectively determine the extent to which beneficial abiotic reductive dechlorination reactions are likely occurring in low permeability (e.g., clayey) zones. This approach may be contraindicated if co-contaminants are present. It is currently unclear whether other classes of potentially reactive chemicals, such as trinitrotoluene (TNT) or chlorinated ethanes, could interact competitively with PCE and TCE.
In addition, it remains unclear how other classes of compounds such as per- and polyfluoroalkyl substances (PFAS) may interact or sorb with ferrous minerals and potentially inhibit abiotic dechlorination reactions. Coupling these recommended activities with conventional site investigation tasks would provide an opportunity to perform many of the up-front screening activities with minimal additional project costs. It is important to note that the guidance proposed herein pertains to particularly low permeability media. Sites with complex or varying lithology, where the mineralogy and/or redox conditions may vary, might require evaluation of multiple samples to provide appropriate site-wide information.
References
- ^ 1.0 1.1 1.2 1.3 1.4 Schaefer, C.E., Tran, D., Nguyen, D., Latta, D.E., Werth, C.J., 2025. Evaluating Mineral and In Situ Indicators of Abiotic Dechlorination in Clayey Soils. Groundwater Monitoring and Remediation, 45(2), pp. 31-39. doi: 10.1111/gwmr.12709
- ^ Falta, R., and Wang, W., 2017. A semi-analytical method for simulating matrix diffusion in numerical transport models. Journal of Contaminant Hydrology, 197, pp. 39-49. doi: 10.1016/j.jconhyd.2016.12.007 Open Access Manuscript
- ^ Kulkarni, P.R., Adamson, D.T., Popovic, J., Newell, C.J., 2022. Modeling a well-charactized perfluorooctane sulfate (PFOS) source and plume using the REMChlor-MD model to account for matrix diffusion. Journal of Contaminant Hydrology, 247, Article 103986. doi: 10.1016/j.jconhyd.2022.103986 Open Access Manuscript
- ^ Schaefer, C.E., Ho, P., Berns, E., Werth, C., 2021. Abiotic dechlorination in the presence of ferrous minerals. Journal of Contaminant Hydrology, 241, 103839. doi: 10.1016/j.jconhyd.2021.103839 Open Access Manuscript
- ^ 5.0 5.1 Schaefer, C.E., Ho, P., Berns, E., Werth, C., 2018. Mechanisms for abiotic dechlorination of trichloroethene by ferrous minerals under oxic and anoxic conditions in natural sediments. Environmental Science and Technology, 52(23), pp.13747-13755. doi: 10.1021/acs.est.8b04108
- ^ Schaefer, C.E., Ho., Gurr, C., Berns, E., Werth, C., 2017. Abiotic dechlorination of chlorinated ethenes in natural clayey soils: impacts of mineralogy and temperature. Journal of Contaminant Hydrology, 206, pp. 10-17. doi: 10.1016/j.jconhyd.2017.09.007 Open Access Manuscript
- ^ Borden, R.C., Cha, K.Y., 2021. Evaluating the impact of back diffusion on groundwater cleanup time. Journal of Contaminant Hydrology, 243, Article 103889. doi: 10.1016/j.jconhyd.2021 Open Access Manuscript
See Also

