|
|
| (264 intermediate revisions by the same user not shown) |
| Line 1: |
Line 1: |
| − | ==Transition of Aqueous Film Forming Foam (AFFF) Fire Suppression Infrastructure Impacted by Per and Polyfluoroalkyl Substances (PFAS)== | + | ==Assessing Vapor Intrusion (VI) Impacts in Neighborhoods with Groundwater Contaminated by Chlorinated Volatile Organic Chemicals (CVOCs)== |
| − | [[Perfluoroalkyl and Polyfluoroalkyl Substances (PFAS)|Per and polyfluoroalkyl substances (PFAS)]] contained in [[wikipedia:Firefighting foam |Class B aqueous film-forming foams (AFFFs)]] are known to accumulate on wetted surfaces of many fire suppression systems after decades of exposure<ref name="LangEtAl2022">Lang, J.R., McDonough, J., Guillette, T.C., Storch, P., Anderson, J., Liles, D., Prigge, R., Miles, J.A.L., Divine, C., 2022. Characterization of per- and polyfluoroalkyl substances on fire suppression system piping and optimization of removal methods. Chemosphere, 308(Part 2), 136254. [https://doi.org/10.1016/j.chemosphere.2022.136254 doi: 10.1016/j.chemosphere.2022.136254] [[Media:LangEtAl2022.pdf | Open Access Article]]</ref>. When replacement PFAS-free firefighting formulations are added to existing infrastructure, PFAS can rebound from the wetted surfaces into the new formulations at high concentrations<ref name=”RossStorch2020”>Ross, I., and Storch, P., 2020. Foam Transition: Is It as Simple as "Foam Out / Foam In?". The Catalyst (Journal of JOIFF, The International Organization for Industrial Emergency Services Management), Q2 Supplement, 20 pages. [[Media:Catalyst_2020_Q2_Sup.pdf | Industry Newsletter]]</ref><ref>Kappetijn, K., 2023. Replacement of fluorinated extinguishing foam: When is clean clean enough? The Catalyst (Journal of JOIFF, The International Organization for Industrial Emergency Services Management), Q1 2023, pp. 31-33. [[Media:Catalyst_2023_Q1.pdf | Industry Newsletter]]</ref>. Effective methods are needed to properly transition to PFAS-free firefighting formulations in existing fire suppression infrastructure. Considerations in the transition process may include but are not limited to locating, identifying, and evaluating existing systems and AFFF, fire engineering evaluations, system prioritization, cost/downtime analyses, sampling and analysis, evaluation of risks and hazards to human health and the environment, transportation, and disposal.
| + | The VI Diagnosis Toolkit<ref name="JohnsonEtAl2020">Johnson, P.C., Guo, Y., Dahlen, P., 2020. The VI Diagnosis Toolkit for Assessing Vapor Intrusion Pathways and Mitigating Impacts in Neighborhoods Overlying Dissolved Chlorinated Solvent Plumes. ESTCP Project ER-201501, Final Report. [https://serdp-estcp.mil/projects/details/a0d8bafd-c158-4742-b9fe-5f03d002af71 Project Website] [//www.enviro.wiki/images/2/28/ER-201501.pdf Final Report.pdf]</ref> is a set of tools that can be used individually or in combination to assess vapor intrusion (VI) impacts at one or more buildings overlying regional-scale dissolved chlorinated solvent impacted groundwater plumes. The strategic use of these tools can lead to confident and efficient neighborhood-scale VI pathway assessments. |
| | + | |
| | <div style="float:right;margin:0 0 2em 2em;">__TOC__</div> | | <div style="float:right;margin:0 0 2em 2em;">__TOC__</div> |
| | | | |
| | '''Related Article(s):''' | | '''Related Article(s):''' |
| − | *[[Perfluoroalkyl and Polyfluoroalkyl Substances (PFAS)]]
| + | |
| − | *[[PFAS Sources]] | + | *[[Vapor Intrusion (VI)]] |
| − | *[[PFAS Ex Situ Water Treatment]]
| + | *[[Vapor Intrusion – Sewers and Utility Tunnels as Preferential Pathways]] |
| − | *[[Supercritical Water Oxidation (SCWO)]]
| |
| − | *[[PFAS Treatment by Electrical Discharge Plasma]] | |
| | | | |
| | '''Contributor(s):''' | | '''Contributor(s):''' |
| − | *Dr. Johnsie Ray Lang | + | |
| − | *Dr. Jonathan Miles
| + | *Paul C. Johnson, Ph.D. |
| − | *John Anderson
| + | *Paul Dahlen, Ph.D. |
| − | *Dr. Theresa Guillette
| + | *Yuanming Guo, Ph.D. |
| − | *[[Craig E. Divine, Ph.D., PG|Dr. Craig Divine]] | |
| − | *[[Dr. Stephen Richardson]]
| |
| | | | |
| | '''Key Resource(s):''' | | '''Key Resource(s):''' |
| − | *Department of Defense (DoD) performance standard for PFAS-free firefighting formulation: [https://media.defense.gov/2023/Jan/12/2003144157/-1/-1/1/MILITARY-SPECIFICATION-FOR-FIRE-EXTINGUISHING-AGENT-FLUORINE-FREE-FOAM-F3-LIQUID-CONCENTRATE-FOR-LAND-BASED-FRESH-WATER-APPLICATIONS.PDF Military Specification MIL-PRF-32725]<ref name="DoD2023">US Department of Defense, 2023. Performance Specification for Fire Extinguishing Agent, Fluorine-Free Foam (F3) Liquid Concentrate for Land-Based, Fresh Water Applications. Mil-Spec MIL-PRF-32725, 18 pages. [[Media: MilSpec32725.pdf | Military Specification Document]]</ref>
| |
| − | *Characterization of per- and polyfluoroalkyl substances on fire suppression system piping and optimization of removal methods<ref name="LangEtAl2022"/>
| |
| | | | |
| − | ==Introduction==
| + | *The VI Diagnosis Toolkit for Assessing Vapor Intrusion Pathways and Impacts in Neighborhoods Overlying Dissolved Chlorinated Solvent Plumes, ESTCP Project ER-201501, Final Report<ref name="JohnsonEtAl2020" /> |
| − | [[File:LangFig1.png | thumb |400px|Figure 1. (A) Schematic of a typical PFAS molecule demonstrating the hydrophobic fluorinated tail in green and the hydrophilic charged functional group in blue, (B) a PFAS bilayer formed with the hydrophobic tails facing inward and the charged functional groups on the outside, and (C) multiple bilayers of PFAS assembled on the wetted surfaces of fire suppression piping.]]PFAS are a class of synthetic fluorinated compounds which are highly mobile and persistent within the environment<ref>Giesy, J.P., Kannan, K., 2001. Global Distribution of Perfluorooctane Sulfonate in Wildlife. Environmental Science and Technology 35(7), pp. 1339-1342. [https://doi.org/10.1021/es001834k doi: 10.1021/es001834k]</ref>. Due to the surfactant properties of PFAS, these compounds self-assemble at any solid-liquid interface forming resilient bilayers during prolonged exposure<ref>Krafft, M.P., Riess, J.G., 2015. Selected physicochemical aspects of poly- and perfluoroalkylated substances relevant to performance, environment and sustainability-Part one. Chemosphere, 129, pp. 4-19. [https://doi.org/10.1016/j.chemosphere.2014.08.039 doi: 10.1016/j.chemosphere.2014.08.039]</ref>. Solid phase accumulation of PFAS has been proposed to be influenced by both hydrophobic and electrostatic interactions with fluorinated carbon chain length as the dominant feature influencing sorption<ref>Higgins, C.P., Luthy, R.G., 2006. Sorption of Perfluorinated Surfactants on Sediments. Environmental Science and Technology, 40(23), pp. 7251-7256. [https://doi.org/10.1021/es061000n doi: 10.1021/es061000n]</ref>. While the majority of previous research into solid phase sorption typically focused on water treatment applications or subsurface porous media<ref>Brusseau, M.L., 2018. Assessing the Potential Contributions of Additional Retention Processes to PFAS Retardation in the Subsurface. Science of the Total Environment, 613-614, pp. 176-185. [https://doi.org/10.1016/j.scitotenv.2017.09.065 doi: 10.1016/j.scitotenv.2017.09.065] [https://www.ncbi.nlm.nih.gov/pmc/articles/PMC5693257/ Open Access Manuscript]</ref>, recently PFAS accumulations have been demonstrated on the wetted surfaces of fire suppression infrastructure exposed to aqueous film forming foam (AFFF)<ref name="LangEtAl2022"/> (see Figure 1).
| |
| − |
| |
| | | | |
| | + | *CPM Test Guidelines: Use of Controlled Pressure Method Testing for Vapor Intrusion Pathway Assessment, ESTCP Project ER-201501, Technical Report<ref name="JohnsonEtAl2021">Johnson, P.C., Guo, Y., Dahlen, P., 2021. CPM Test Guidelines: Use of Controlled Pressure Method Testing for Vapor Intrusion Pathway Assessment. ESTCP ER-201501, Technical Report. [https://serdp-estcp.mil/projects/details/a0d8bafd-c158-4742-b9fe-5f03d002af71 Project Website] [//www.enviro.wiki/images/c/c7/ER-201501_Technical_Report.pdf Technical_Report.pdf]</ref> |
| | | | |
| − | Discharges of contaminated groundwater to surface water bodies threaten ecosystems and degrade the quality of surface water resources. Subsurface heterogeneity associated with the geological setting and stratigraphy often results in such discharges occurring as localized zones (or seeps) of contaminated groundwater. Traditional methods for investigating GWSWE include [https://books.gw-project.org/groundwater-surface-water-exchange/chapter/seepage-meters/#:~:text=Seepage%20meters%20measure%20the%20flux,that%20it%20isolates%20water%20exchange. seepage meters]<ref>Rosenberry, D. O., Duque, C., and Lee, D. R., 2020. History and Evolution of Seepage Meters for Quantifying Flow between Groundwater and Surface Water: Part 1 – Freshwater Settings. Earth-Science Reviews, 204(103167). [https://doi.org/10.1016/j.earscirev.2020.103167 doi: 10.1016/j.earscirev.2020.103167].</ref><ref>Duque, C., Russoniello, C. J., and Rosenberry, D. O., 2020. History and Evolution of Seepage Meters for Quantifying Flow between Groundwater and Surface Water: Part 2 – Marine Settings and Submarine Groundwater Discharge. Earth-Science Reviews, 204 ( 103168). [https://doi.org/10.1016/j.earscirev.2020.103168 doi: 10.1016/j.earscirev.2020.103168].</ref>, which directly quantify the volume flux crossing the bed of a surface water body (i.e, a lake, river or wetland) and point probes that locally measure key water quality parameters (e.g., temperature, pore water velocity, specific conductance, dissolved oxygen, pH). Seepage meters provide direct estimates of seepage fluxes between groundwater and surface- water but are time consuming and can be difficult to deploy in high energy surface water environments and along armored bed sediments. Manual seepage meters rely on quantifying volume changes in a bag of water that is hydraulically connected to the bed. Although automated seepage meters such as the [https://clu-in.org/programs/21m2/navytools/gsw/#ultraseep Ultraseep system] have been developed, they are generally not suitable for long term deployment (weeks to months). The US Navy has developed the [https://clu-in.org/programs/21m2/navytools/gsw/#trident Trident probe] for more rapid (relative to seepage meters) sampling, whereby the probe is inserted into the bed and point-in-time pore water quality and sediment parameters are directly recorded (note that the Trident probe does not measure a seepage flux). Such direct probe-based measurements are still relatively time consuming to acquire, particularly when reconnaissance information is required over large areas to determine the location of discrete seeps for further, more quantitative analysis.
| + | *VI Diagnosis Toolkit User Guide, ESTCP Project ER-201501<ref name="JohnsonEtAl2022">Johnson, P.C., Guo, Y., and Dahlen, P., 2022. VI Diagnosis Toolkit User Guide, ESTCP ER-201501, User Guide. [https://serdp-estcp.mil/projects/details/a0d8bafd-c158-4742-b9fe-5f03d002af71 Project Website] [//www.enviro.wiki/images/2/22/ER-201501_User_Guide.pdf User_Guide.pdf]</ref> |
| | | | |
| − | Over the last few decades, a broader toolbox of hydrogeophysical technologies has been developed to rapidly and non-invasively evaluate zones of GWSWE in a variety of surface water settings, spanning from freshwater bodies to saline coastal environments. Many of these technologies are currently being deployed under a Department of Defense Environmental Security Technology Certification Program ([https://serdp-estcp.mil/ ESTCP]) project ([https://serdp-estcp.mil/projects/details/e4a12396-4b56-4318-b9e5-143c3011b8ff ER21-5237]) to demonstrate the value of the toolbox to remedial program managers (RPMs) dealing with the challenge of characterizing surface water contamination via groundwater from facilities proximal to surface water bodies. This article summarizes these technologies and provides references to key resources, mostly provided by the [https://www.usgs.gov/mission-areas/water-resources Water Resources Mission Area] of the United States Geological Survey that describe the technologies in further detail.
| + | ==Introduction== |
| | + | Most federal, state, and local regulatory guidance for assessing and mitigating the [[Vapor Intrusion (VI) | vapor intrusion]] pathway reflects USEPA’s ''Technical Guide for Assessing and Mitigating the Vapor Intrusion Pathway from Subsurface Vapor Sources to Indoor Air''<ref name="USEPA2015">USEPA, 2015. OSWER Technical Guide for Assessing and Mitigating the Vapor Intrusion Pathway from Subsurface Vapor Sources to Indoor Air. U.S. Environmental Protection Agency, Office of Solid Waste and Emergency Response, OSWER Publication No. 9200.2-154, 267 pages. [https://www.epa.gov/vaporintrusion/technical-guide-assessing-and-mitigating-vapor-intrusion-pathway-subsurface-vapor USEPA Website] [//www.enviro.wiki/images/0/06/USEPA2015.pdf Report.pdf]</ref>. The paradigm outlined by that guidance includes: 1) a preliminary and mostly qualitative analysis that looks for site conditions that suggest vapor intrusion might occur (e.g., the presence of vapor-forming chemicals in close proximity to buildings); 2) a multi-step and more detailed quantitative screening analysis that involves site-specific data collection and their comparison to screening levels to identify buildings of potential VI concern; and 3) selection and design of mitigation systems or continued monitoring, as needed. With respect to (2), regulatory guidance typically recommends consideration of “multiple lines of evidence” in decision-making<ref name="USEPA2015" /><ref>NJDEP, 2021. Vapor Intrusion Technical Guidance, Version 5.0. New Jersey Department of Environmental Protection, Trenton, NJ. [https://dep.nj.gov/srp/guidance/vapor-intrusion/vig/ Website] [//www.enviro.wiki/images/e/ee/NJDEP2021.pdf Guidance Document.pdf]</ref>, with typical lines-of-evidence being groundwater, soil gas, sub-slab soil gas, and/or indoor air concentrations. Of those, soil gas measurements and/or measured short-term indoor air concentrations can be weighted heavily, and therefore decision making might not be completed without them. Effective evaluation of VI risk from sub-slab and/or soil gas measurements would require an unknown building-specific attenuation factor, but there is also uncertainty as to whether or not indoor air data is representative of maximum and/or long-term average indoor concentrations. Indoor air data can be confounded by indoor contaminant sources because the number of samples is typically small, indoor concentrations can vary with time, and because a number of household products can emit the chemicals being measured. When conducting VI pathway assessments in neighborhoods where it is impractical to assess all buildings, the EPA recommends following a “worst first” investigational approach. |
| | | | |
| − | ==Hydrogeophysical Technologies for Understanding Groundwater-Surface Water Interactions==
| + | The limitations of this approach, as practiced, are the following: |
| − | [[Wikipedia: Hydrogeophysics |Hydrogeophysical technologies]] exploit contrasts in the physical properties between groundwater and surface water to detect and monitor zones of pronounced GWSWE. The two most valuable properties to measure are temperature and electrical conductivity. Temperature has been used for decades as an indicator of groundwater-surface water exchange<ref>Constantz, J., 2008. Heat as a Tracer to Determine Streambed Water Exchanges. Water Resources Research, 44 (4).[https://doi.org/https://doi.org/10.1029/2008WR006996 doi: 10.1029/2008WR006996].[https://agupubs.onlinelibrary.wiley.com/doi/epdf/10.1029/2008WR006996 Open Access Article]</ref> with early uses including pushing a thermistor into the bed of a surface water body to assess zones of surface water downwelling and groundwater upwelling. Today, a variety of novel technologies that measure temperature over a wide range of spatial and temporal scales are being used to investigate GWSWE. The evaluation of electrical conductivity measurements using point probes and geophysical imaging is also well-established. However, new technologies are now available to exploit electrical conductivity contrasts from GWSWE occurring over a range of spatial and temporal scales.
| |
| | | | |
| − | ===Temperature-Based Technologies===
| + | *Decisions are rarely made without indoor air data and generally, seasonal sampling is required, delaying decision making. |
| − | Several temperature-based GWSWE methodologies exploit the gradient in temperature between surface water and groundwater that exist during certain times of day or seasons of the year. The thermal insulation provided by the Earth’s land surface means that groundwater is warmer than surface water in winter months, but colder than surface water in summer months away from the equator. Therefore, in temperate climates, localized (or ‘preferential’) groundwater discharge into surface water bodies is often observed as cold temperature anomalies in the summer and warm temperature anomalies in the winter. However, there are times of the year such as fall and spring when contrasts in the temperature between groundwater and surface water will be minimal, or even undetectable. These seasonal-driven points in time correspond to the switch in the polarity of the temperature contrast between groundwater and surface water. Consequently, SW to GW gradient temperature-based methods are most effective when deployed at times of the year when the temperature contrasts between groundwater and surface water are greatest. Other time-series temperature monitoring methods depend more on natural daily signals measured at the bed interface and in bed sediments, and those signals may exist year round except where strongly muted by ice cover or surface water stratification. A variety of sensing technologies now exist within the GWSWE toolbox, from techniques that rapidly characterize temperature contrasts over large areas, down to powerful monitoring methods that can continuously quantify GWSWE fluxes at discrete locations identified as hotspots.
| + | *The collection of a robust indoor air data set that adequately characterizes long term indoor air concentrations could take years given the typical frequency of data collection and the most common methods of sample collection (e.g., 24-hour samples). Therefore, indoor air sampling might continue indefinitely at some sites. |
| | + | *The “worst first” buildings might not be identified correctly by the logic outlined in USEPA’s 2015 guidance and the most impacted buildings might not even be located over a groundwater plume. Recent studies have shown [[Vapor Intrusion – Sewers and Utility Tunnels as Preferential Pathways |VI impacts in homes as a result of sewer and other subsurface piping connections]], which are not explicitly considered nor easily characterized through conventional VI pathway assessment<ref> Beckley, L, McHugh, T., 2020. A Conceptual Model for Vapor Intrusion from Groundwater Through Sewer Lines. Science of the Total Environment, 698, Article 134283. [https://doi.org/10.1016/j.scitotenv.2019.134283 doi: 10.1016/j.scitotenv.2019.134283] [//www.enviro.wiki/images/4/4e/BeckleyMcHugh2020.pdf Open Access Article]</ref><ref name="GuoEtAl2015">Guo, Y., Holton, C., Luo, H., Dahlen, P., Gorder, K., Dettenmaier, E., Johnson, P.C., 2015. Identification of Alternative Vapor Intrusion Pathways Using Controlled Pressure Testing, Soil Gas Monitoring, and Screening Model Calculations. Environmental Science and Technology, 49(22), pp. 13472–13482. [https://doi.org/10.1021/acs.est.5b03564 doi: 10.1021/acs.est.5b03564]</ref><ref name="McHughEtAl2017">McHugh, T., Beckley, L., Sullivan, T., Lutes, C., Truesdale, R., Uppencamp, R., Cosky, B., Zimmerman, J., Schumacher, B., 2017. Evidence of a Sewer Vapor Transport Pathway at the USEPA Vapor Intrusion Research Duplex. Science of the Total Environment, pp. 598, 772-779. [https://doi.org/10.1016/j.scitotenv.2017.04.135 doi: 10.1016/j.scitotenv.2017.04.135] [//www.enviro.wiki/images/6/63/McHughEtAl2017.pdf Open Access Manuscipt]</ref><ref name="McHughBeckley2018">McHugh, T., Beckley, L., 2018. Sewers and Utility Tunnels as Preferential Pathways for Volatile Organic Compound Migration into Buildings: Risk Factors and Investigation Protocol. ESTCP ER-201505, Final Report. [https://serdp-estcp.mil/projects/details/f12abf80-5273-4220-b09a-e239d0188421 Project Website] [//www.enviro.wiki/images/5/55/2018b-McHugh-ER-201505_Conceptual_Model.pdf Final Report.pdf]</ref><ref name="RiisEtAl2010">Riis, C., Hansen, M.H., Nielsen, H.H., Christensen, A.G., Terkelsen, M., 2010. Vapor Intrusion through Sewer Systems: Migration Pathways of Chlorinated Solvents from Groundwater to Indoor Air. Seventh International Conference on Remediation of Chlorinated and Recalcitrant Compounds, May, Monterey, CA. Battelle Memorial Institute. ISBN 978-0-9819730-2-9. [https://www.battelle.org/conferences/battelle-conference-proceedings Website] [//www.enviro.wiki/images/9/95/2010-Riis-Migratioin_pathways_of_Chlorinated_Solvents.pdf Report.pdf]</ref>. |
| | + | *The presumptive remedy for VI mitigation (sub-slab depressurization) may not be effective for all VI scenarios (e.g., those involving vapor migration to indoor spaces via sewer connections). |
| | + | |
| | + | The '''VI Diagnosis Toolkit''' components were developed considering these limitations as well as more recent knowledge gained through research, development, and validation projects funded by SERDP and ESTCP. |
| | | | |
| − | ====Characterization Methods==== | + | ==The VI Diagnosis Toolkit Components== |
| − | The primary use of the characterization methods is to rapidly determine precise locations of groundwater upwelling over large areas in order to pinpoint locations for subsequent ground-based observations. A common limitation of these methods is that they can only sense groundwater fluxes into surface water. Methods applied at the water surface and in the surface water column generally cannot detect localized regions of surface water transfer to groundwater, for which temperature measurements collected within the bed sediments are needed. This is a more challenging characterization task that may, in the right conditions, be addressed using electrical conductivity-based methods described later in this article. | + | [[File:DahlenFig1.png|thumb|450px|Figure 1. Vapor intrusion pathway conceptualization considering “alternate VI pathways”, including “pipe flow |
| | + | VI” and “sewer VI” pathways<ref name="JohnsonEtAl2020" />.]] |
| | + | The primary components of the VI Diagnosis Toolkit and their uses include: |
| | | | |
| − | =====''Unmanned Aerial Vehicle Infrared (UAV-IR)''=====
| + | *'''External VI source strength screening''' to identify buildings most likely to be impacted by VI at levels warranting building-specific testing. |
| − | [[File:IeryFig1.png | thumb |600px|Figure 1. UAV IR orthomosaics with estimated scale of (a) a wetland in winter (modified from Briggs et al.<ref>Briggs, M. A., Jackson, K. E., Liu, F., Moore, E. M., Bisson, A., Helton, A. M., 2022. Exploring Local Riverbank Sediment Controls on the Occurrence of Preferential Groundwater Discharge Points. Water, 14(1). [https://doi.org/10.3390/w14010011 doi: 10.3390/w14010011] [https://www.mdpi.com/2073-4441/14/1/11 Open Access Article].</ref>) and (b) a mountain stream in summer (modified from Briggs et al.<ref>Briggs, M. A., Wang, C., Day-Lewis, F. D., Williams, K. H., Dong, W., Lane, J. W., 2019. Return Flows from Beaver Ponds Enhance Floodplain-to-River Metals Exchange in Alluvial Mountain Catchments. Science of the Total Environment, 685, pp. 357–369. [https://doi.org/10.1016/j.scitotenv.2019.05.371 doi: 10.1016/j.scitotenv.2019.05.371]. [https://pdf.sciencedirectassets.com/271800/1-s2.0-S0048969719X00273/1-s2.0-S0048969719324246/am.pdf?X-Amz-Security-Token=IQoJb3JpZ2luX2VjEE0aCXVzLWVhc3QtMSJGMEQCIBY8ykhAP941wHO1NKj8EmXG3btdpgX6HaUV9zAo0PCMAiACRjzV0D2lbFFwnhUzEqBupGsgX6DkK62ZIEvb%2B0irbiq8BQj2%2F%2F%2F%2F%2F%2F%2F%2F%2F%2F8BEAUaDDA1OTAwMzU0Njg2NSIMPmS2kZBwKKMGD%2F6GKpAFaY6lOuHO%2B1RkV%2FL6NkK74dL6YJculUqyZJn9s09njF1L%2Bb4LgjH%2FbawysWGvGeuH%2FQtSgwqFM90MQ4grDiDQPHUjSEDNVuN2II%2BqPK4oqkjqxwTmC2AObe%2FMY1c45L2nshYodZwtROh6Hl8Jp4B4HoDPE9wx1fEw7DGmB%2Bj70q5PG7%2FUUo3rLl6BCMT%2FWKFGfZSaOmaD5nweVaTRBUbgSVIcmCQKshE28TkHFpmwY58YNO0GjaKHXMsBNciZ2DvIPAHMyA1iymB7UFcoBRDicZJUDZvvnJNGj1bTX9tEQ49yil7IWD22hKPHL5nSogssocX5rRXiIglVT%2BAzHsMMyxfVxfFGBsmmSGAVG9FAeRPgx1T%2FIOqNo%2FOuyV9G%2BVSt5boUg4HBaZSvW5JNkL5bFpaMlrUTpMF%2F6Bbq3Q6EsiZMaFF0JOS3rvX5dkDlfu7OzJDBuRBszYoq%2B4%2FLQGJypfmarz8ZHEzi3Qw85nYbT68UGNa%2BZ9lZQG%2B47mF6Nj11%2F%2Fu%2FDTZD1p4r9nskTevwkRE%2BL7q3OSbqFj4YvN6qsMBLb%2FM7K2xSmaots0YGisZ09fVJBetJ1ILZpN5wCbS%2F77uFeQoxYXGIwz84wyqSueP7qcj3BQ%2FMkZRbmVpokj3vtESlfHvcZV2Ntu95JM9hetE9F5azaZ%2F%2Fm3WTE2mgW48FCbFI09p%2F7%2FSJyEWl54lNG7%2F2y0AayedFUs75otJauCpNJtr2pF4sbAGfgiagA2%2BzeDatKnI7MDhMD0R27wvaVwEup6vkLmTaJh4P8bGFd01Fwj96gZIKESW6HfwGXMBMj%2FoJn3CYpcfVelPmDr6jTeSJapUJoWE8gQVFjWuISuD4PdHYtbiSBL%2Fjn5jPvGMwvrqrrQY6sgEtK%2Fo3hSElpY%2Be20Xj4eNAJ%2BFmkb5nASAJvtygtnSdoc%2FBHMv4U3Je92nbunzwAwXaVCZ8FBK1%2F2cmq3sYLNOyPEJrCNqAo0Lgf137RvhaJb7erYXXfL7UCz1hePrG3I3bgKkBRN5PD%2FSlu%2BSSEimoEn4kCyxoaNYI9QvymaTlHZJM0ueXCYprlRfMneJXxnEVyC3qlMsTMtcL%2B45koHZeeTQJUMXWJB%2BYQxNDmNM3ZHH4&X-Amz-Algorithm=AWS4-HMAC-SHA256&X-Amz-Date=20240119T205045Z&X-Amz-SignedHeaders=host&X-Amz-Expires=300&X-Amz-Credential=ASIAQ3PHCVTYV2JHRO6K%2F20240119%2Fus-east-1%2Fs3%2Faws4_request&X-Amz-Signature=3befd4efcf96517aad4e02a2d76e82cd278f02be8a60a5136a4981889df64f00&hash=c0f70e64bfdb70375c685714475b258099c0d0b19a2a7a556e77182cc6cfac9c&host=68042c943591013ac2b2430a89b270f6af2c76d8dfd086a07176afe7c76c2c61&pii=S0048969719324246&tid=pdf-5d6462f0-c794-4158-b89d-2a1f5b96a226&sid=8b33666922432845420b6d75b151281148eegxrqa&type=client Open Access Manuscript]</ref>) that both capture multiscale groundwater discharge processes. Figure reproduced from Mangel et al.<ref>Mangel, A. R., Dawson, C. B., Rey, D. M., Briggs, M. A., 2022. Drone Applications in Hydrogeophysics: Recent Examples and a Vision for the Future. The Leading Edge, 41 (8), pp. 540–547. [https://doi.org/10.1190/tle41080540.1 doi: 10.1190/tle41080540].</ref>]]
| + | *'''Indoor air source screening''' to locate and remove indoor air sources that might confound building specific VI pathway assessment. |
| − | [[Wikipedia: Unmanned aerial vehicle | Unmanned aerial vehicles (UAVs)]] equipped with thermal infrared (IR) cameras can provide a very powerful tool for rapidly determining zones of pronounced upwelling of groundwater to surface water. Large areas of can be covered with high spatial resolution. The information obtained can be used to rapidly define locations of focused groundwater upwelling and prioritize these for more intensive surface-based observations (Figure 1). As with all thermal methods, flights must be performed when adequate contrasts in temperature between surface water and groundwater are expected to exist. Not just time of year but, because of the effect of the diurnal temperature signal on surface water bodies, time of day might need to be considered in order to maximize the chance of success. Calibration of UAV-IR camera measurements against simultaneously acquired direct measurements of temperature is recommended to optimize the value of these datasets. UAV-IR methods will not work in all situations. One major limitation of the technology is that the temperature expression of groundwater upwelling must be manifested at the surface of the surface water body. Consequently, the technology will not detect relatively small discharges occurring beneath a relatively deep surface water layer, and thermal imaging over the water surface can be complicated by thermal IR reflection. The chances of success with UAV-IR will be strongest in regions of exposed banks or shallow water where there are no strong currents causing mixing (and thus dilution) of the upwelling groundwater temperature signals. UAV-IR methods will therefore likely be most successful close to shorelines of lakes/ponds, over shallow, low flow streams and rivers and in wetland environments. UAV-IR methods require a licensed pilot, and restrictions on the use of airspace may limit the application of this technology.
| + | *'''Controlled pressurization method (CPM)''' testing to quickly (in a few days or less) measure the worst-case indoor air impact likely to be caused by VI under natural conditions in specific buildings. CPM tests can also be used to identify the presence of indoor air sources and diagnose active VI pathways. |
| | + | *'''Passive indoor sampling''' for determining long-term average indoor air concentrations under natural VI conditions and/or for verifying mitigation system effectiveness in buildings that warrant VI mitigation. |
| | + | *'''Comprehensive VI conceptual model development and refinement''' to ensure that appropriate monitoring, investigation, and mitigation strategies are being selected (Figure 1). |
| | | | |
| − | =====''Handheld Thermal Infrared (TIR) Cameras''=====
| + | Expanded discussions for each of these are given below. |
| − | [[File:IeryFig2.png | thumb|left |600px|Figure 2. (a) A TIR camera set up to image groundwater discharges to surface water (b) TIR data inset on a visible light photograph. Cooler (blue) bank seepage groundwater is discharging into warmer (red) stream water (temperature scale in degrees). Both photographs courtesy of Martin Briggs USGS.]]
| |
| − | Hand-held thermal infrared (TIR) cameras are powerful tools for visual identification of localized seeps of upwelling groundwater. TIR cameras may be used to follow up on UAV-IR surveys to better characterize local seeps identified from the air using UAV-IR. Alternatively, a TIR camera is a valuable tool when performing initial walks of prospective study sites as they may quickly confirm the presence of suspected seeps. TIR cameras provide high resolution images that can define the structure of localized seeps and may provide valuable insights into the role of discrete features (e.g., fractures in rocks or pipes in soil) in determining seep morphology (Figure 2). Like UAV-IR, TIR provides primarily qualitative information (location, extent) of seeps and it only succeeds when there are adequate contrasts between groundwater and surface water that are expressed at the surface of the investigated water body or along bank sediments. The United States Geological Survey (USGS) has made extensive use of TIR cameras for studying groundwater/surface-water exchange.
| |
| | | | |
| − | =====''Continuous Near-bed Temperature Sensing''=====
| + | '''External VI source strength screening''' identifies those buildings that warrant more intrusive building-specific assessments, using data collected exterior to the buildings. The use of groundwater and/or soil gas concentration data for building screening has been part of VI pathway assessments for some time and their use is discussed in many regulatory guidance documents. Typically, the measured concentrations are compared to relevant screening levels derived via modeling or empirical analyses from indoor air concentrations of concern. |
| − | When performing surveys from a boat a simple yet often powerful technology is continuous
| |
| − | near-bed temperature sensing, whereby a temperature probe is strategically suspended to float in the water column just above the bed or dragged along it. Compared to UAV-IR, this approach does not rely on upwelling groundwater being expressed as a temperature anomaly at the surface. The utility of the method can be enhanced when a specific conductance probe is co- located with the temperature probe so that anomalies in both temperature and specific conductance can be investigated.
| |
| | | | |
| − | ====Monitoring Methods====
| + | More recently it has been discovered that VI impacts can occur via sewer and other subsurface piping connections in areas where vapor migration through the soil would not be expected to be significant, and this could also occur in buildings that do not sit over contaminated groundwater<ref name="RiisEtAl2010" /><ref name="GuoEtAl2015" /><ref name="McHughEtAl2017" /><ref name="McHughBeckley2018" />. |
| − | Monitoring methods allow temperature signals to be recorded with high temporal resolution along the bed interface or within bank or bed sediments. These methods can capture temporal trends in GWSWE driven by variations in the hydraulic gradients around surface water bodies, as well as changes in [[Wikipedia: Hydraulic conductivity | hydraulic conductivity]] due to sedimentation, clogging, scour or microbial mass. If vertical profiles of bed temperature are collected, a range of analytical and numerical models can be applied to infer the vertical water flux rate and direction, similar to a seepage meter. These fluxes may vary as a function of season, rainfall events (enhanced during storm activity), tidal variability in coastal settings and due to engineered controls such as dam discharges. The methods can capture evidence of GWSWE that may not be detected during a single ‘characterization’ survey if the local hydraulic conditions at that point in time result in relatively weak hydraulic gradients.
| |
| | | | |
| − | =====''Fiber-optic Distributed Temperature Sensing (FO-DTS)''=====
| + | Therefore, in addition to groundwater and soil gas sampling, external data collection that includes and extends beyond the area of concern should include manhole vapor sampling (e.g., sanitary sewer, storm sewer, land-drain). Video surveys from sanitary sewers, storm sewers, and/or land-drains can also be used to identify areas of groundwater leakage into utility corridors and lateral connections to buildings that are conduits for vapor transport. During these investigations, it is important to recognize that utility corridors can transmit both impacted water and vapors beyond groundwater plume boundaries, so extending investigations into areas adjacent to groundwater plume boundaries is necessary. |
| − | [[File:IeryFig3.png | thumb|600px|Figure 3. (a) Basic concept of FO-DTS based on backscattering of light transmitted down a FO fiber (b) Example of riverbed temperature data acquired over time and space in relation to variation in river stage (black line) modified from Mwakanyamale et al.<ref>Mwakanyamale, K., Slater, L., Day-Lewis, F., Elwaseif, M., Johnson, C., 2012. Spatially Variable Stage-Driven Groundwater-Surface Water Interaction Inferred from Time-Frequency Analysis of Distributed Temperature Sensing Data. Geophysical Research Letters, 39(6). [https://doi.org/10.1029/2011GL050824 doi: 10.1029/2011GL050824]. [https://agupubs.onlinelibrary.wiley.com/doi/epdf/10.1029/2011GL050824 Open Access Article]</ref> (c) spatial distribution of riverbed temperature and correlation coefficient (CC) between riverbed temperature and river stage for a 1.5 km stretch along the Hanford 300 Area adjacent to the Columbia River (modified from Slater et al.<ref name=”Slater2010”/>). Data are shown for winter and summer. Orange contours show uranium concentrations (μg/L) in groundwater measured in boreholes.]]
| |
| − | Fiber-optic distributed temperature sensing (FO-DTS) is a powerful monitoring technology used in fire detection, industrial process monitoring, and petroleum reservoir monitoring. The method is also used to obtain spatially rich datasets for monitoring GWSWE<ref name=”Selker2006”>Selker, J. S., Thévenaz, L., Huwald, H., Mallet, A., Luxemburg, W., van de Giesen, N., Stejskal, M., Zeman, J., Westhoff, M., Parlange, M. B., 2006. Distributed Fiber-Optic Temperature Sensing for Hydrologic Systems. Water Resources Research, 42 (12). [https://doi.org/10.1029/2006WR005326 doi: 10.1029/2006WR005326]. [https://agupubs.onlinelibrary.wiley.com/doi/epdf/10.1029/2006WR005326 Open Access Article]</ref><ref name=”Tyler2009”>Tyler, S. W., Selker, J. S., Hausner, M. B., Hatch, C. E., Torgersen, T., Thodal, C. E., Schladow, S. G., 2009. Environmental Temperature Sensing Using Raman Spectra DTS Fiber-Optic Methods. Water Resources Research, 45(4). [https://doi.org/https://doi.org/10.1029/2008WR007052 doi: 10.1029/2008WR007052]. [https://agupubs.onlinelibrary.wiley.com/doi/epdf/10.1029/2008WR007052 Open Access Article]</ref>. The sensor consists of standard telecommunications fiber-optic fiber typically housed in armored cable and the physics is based on temperature-dependent backscatter mechanisms including Brillouin and Raman backscatter<ref name=”Selker2006”/>. Most commercially available systems are based on analysis of Raman scatter. As laser light is transmitted down the fiber-optic cable, light scatters continuously back toward the instrument from all along the fiber, with some of the scattered light at frequencies above and below the frequency of incident light, i.e., anti-Stokes and Stokes-Raman backscatter, respectively. The ratio of anti-Stokes to Stokes energy provides the basis for FO-DTS measurements. Measurements are localized to a section of cable according to a time-of-flight calculation (i.e., optical time-domain reflectometry). Assuming the speed of light within the fiber is constant, scatter collected over a specific time window corresponds to a specific spatial interval of the fiber. Although there are tradeoffs between spatial resolution, thermal precision, and sampling time, in practice it is possible to achieve sub meter-scale spatial and approximate 0.1°C thermal precision for measurement cycle times on the order of minutes and cables extending several kilometers<ref name=”Tyler2009”/>; thus, thousands of temperature measurements can be made simultaneously along a single cable. The method allows the visualization of a large amount of temperature data and rapid identification of major trends in GWSWE. Figure 3 illustrates the use of FO-DTS to detect and monitor zones of focused groundwater discharge along a 1.5 km reach of the Columbia River that is threatened by contaminated groundwater<ref name=”Slater2010”>Slater, L. D., Ntarlagiannis, D., Day-Lewis, F. D., Mwakanyamale, K., Versteeg, R. J., Ward, A., Strickland, C., Johnson, C. D., Lane Jr., J. W., 2010. Use of Electrical Imaging and Distributed Temperature Sensing Methods to Characterize Surface Water-Groundwater Exchange Regulating Uranium Transport at the Hanford 300 Area, Washington. Water Resources Research, 46(10). [https://doi.org/10.1029/2010WR009110 doi: 10.1029/2010WR009110]. [https://agupubs.onlinelibrary.wiley.com/doi/epdf/10.1029/2010WR009110 Open Access Article]</ref>. As temperature is only sensed at the cable on the bed, FO-DTS can only detect groundwater inputs to surface water. It cannot detect losses of surface water to groundwater. The USGS public domain software tool [https://www.usgs.gov/software/dtsgui DTSGUI] allows a user to import, manage, visualize and analyze FO-DTS datasets.
| |
| | | | |
| − | =====''Vertical Temperature Profilers (VTPs)''=====
| + | Using projected indoor air concentrations from modeling and empirical data analyses, and distance screening approaches, external source screening can identify areas and buildings that can be ruled out, or conversely, those that warrant building-specific testing. |
| − | Analysis methods now allow for the accurate quantification of groundwater fluxes over time. Vertical temperature profilers (VTPs) are sensors applied for diurnal temperature data collection within saturated geologic matrices (Figure 4). Extensive experience with VTPs indicates that the methodology is equal to traditional seepage meters in terms of flux accuracy<ref>Hare, D. K., Briggs, M. A., Rosenberry, D. O., Boutt, D. F., Lane Jr., J. W., 2015. A Comparison of Thermal Infrared to Fiber-Optic Distributed Temperature Sensing for Evaluation of Groundwater Discharge to Surface Water. Journal of Hydrology, 530, pp. 153–166. [https://doi.org/10.1016/j.jhydrol.2015.09.059 doi: 10.1016/j.jhydrol.2015.09.059].</ref>. However, VTPs have the advantage of measuring continuous temporal variations in flux rates while such information is impractical to obtain with traditional seepage meters.
| |
| − | [[File:IeryFig4.png |thumb|600px|left|Figure 4. (a) Schematic of different VTP setups including (from left to right) thermistors in a piezometer, thermistors embedded in a solid rod and wrapped FO-DTS cable modified from Irvine et al.<ref name=”Irvine2017a”/>; (b) construction of VTPs showing thermistors embedded in rods and subsequent insulation; (c) example dataset plotted in 1DTempPro showing 5 days of streambed temperature at 6 streambed depths<ref>Koch, F. W., Voytek, E. B., Day-Lewis, F. D., Healy, R., Briggs, M. A., Lane Jr., J. W., Werkema, D., 2016. 1DTempPro V2: New Features for Inferring Groundwater/Surface-Water Exchange. Groundwater, 54(3), pp. 434–439. [https://doi.org/10.1111/gwat.12369 doi: 10.1111/gwat.12369].</ref>.]]
| |
| | | | |
| − | The low-cost design, ease of data collection, and straightforward interpretation of the data using open-source software make VTP sensors increasingly attractive for quantifying flux rates. These sensors typically consist of at least two temperature loggers installed within a steel or plastic pipe filled with foam insulation<ref name=”Irvine2017a”>Irvine, D. J., Briggs, M. A., Cartwright, I., Scruggs, C. R., Lautz, L. K., 2016. Improved Vertical Streambed Flux Estimation Using Multiple Diurnal Temperature Methods in Series. Groundwater, 55(1), pp. 73-80. [https://doi.org/10.1111/gwat.12436 doi: 10.1111/gwat.12436].</ref> although the use of loggers installed in well screens or FO-DTS cable wrapped around a piezometer casing (for high vertical resolution data) are also possible (Figure 4a). Loggers are inserted into the insulated housing at different depths, typically starting from one centimeter within the geologic matrix of interest<ref name=”Irvine2017b”> Irvine, D. J., Briggs, M. A., Lautz, L. K., Gordon, R. P., McKenzie, J. M., Cartwright, I., 2017. Using Diurnal Temperature Signals to Infer Vertical Groundwater-Surface Water Exchange. Groundwater, 55(1), pp. 10–26. [https://doi.org/10.1111/gwat.12459 doi: 10.1111/gwat.12459]. [https://ngwa.onlinelibrary.wiley.com/doi/am-pdf/10.1111/gwat.12459 Open Access Manuscript]</ref>. Temperature loggers usually remain within the first 0.2-meters of the geologic matrix based on the observed limits of diurnal signal influence<ref>Briggs, M. A., Lautz, L. K., Buckley, S. F., Lane Jr., J. W., 2014. Practical Limitations on the Use of Diurnal Temperature Signals to Quantify Groundwater Upwelling. Journal of Hydrology, 519(B), pp. 1739–1751. [https://doi.org/10.1016/j.jhydrol.2014.09.030 doi: 10.1016/j.jhydrol.2014.09.030].</ref>, though zones of strong surface water downwelling may necessitate deeper temperature data collection. Reliability of flux values generated from the temperature signal analysis is dependent in part on the temperature logger precision, VTP placement, sediment heterogeneity, flow direction, flow magnitude<ref name=”Irvine2017b”/>, and absence of macropore flow. Application of single dimension temperature-based fluid flux models assumes that all flow is vertical and therefore lateral flow within upwelling systems cannot be quantified using VTPs, emphasizing the importance of the VTP installation location over the active area of exchange<ref name=”Irvine2017b”/> at shallow depths. Thermal parameters of the geologic matrix where the VTP is installed can be measured using a thermal properties analyzer to record heat capacity and thermal conductivity for later analytical and numerical modeling.
| + | Demonstration of neighborhood-scale external VI source screening using groundwater, depth, sewer, land drain, and video data is documented in the ER-201501 final report<ref name="JohnsonEtAl2020" />. |
| | | | |
| − | Analytical and numerical solutions, used to solve or estimate the advection-conduction equation within the geologic matrix (bed sediments), continue to evolve to better quantify flux values over time. Analytical solutions to the heat transport equation are used to solve for flux values between sensor pairs from VTP datasets<ref name=”Gordon2012”>Gordon, R. P., Lautz, L. K., Briggs, M. A., McKenzie, J. M., 2012. Automated Calculation of Vertical Pore-Water Flux from Field Temperature Time Series Using the VFLUX Method and Computer Program. Journal of Hydrology, 420–421, pp. 142–158. [https://doi.org/10.1016/j.jhydrol.2011.11.053 doi: 10.1016/j.jhydrol.2011.11.053].</ref><ref name=”Irvine2015”>Irvine, D. J., Lautz, L. K., Briggs, M. A., Gordon, R. P., McKenzie, J. M., 2015. Experimental Evaluation of the Applicability of Phase, Amplitude, and Combined Methods to Determine Water Flux and Thermal Diffusivity from Temperature Time Series Using VFLUX 2. Journal of Hydrology, 531(3), pp. 728–737. [https://doi.org/10.1016/j.jhydrol.2015.10.054 doi: 10.1016/j.jhydrol.2015.10.054].</ref>. [https://data.usgs.gov/modelcatalog/model/a54608c5-ea6c-4d61-afc4-1ae851f46744 VFLUX] is an open-source MATLAB package that allows the user to solve for flux values from a VTP dataset using a variety of analytical solutions<ref name=”Gordon2012”/><ref name=”Irvine2015”/> based on the vertical propagation of diurnal temperature signals. Other emerging ‘spectral’ methods make use of a wide range of natural temperature signals to estimate vertical flux and bed sediment thermal diffusivity<ref>Sohn, R. A., Harris, R. N., 2021. Spectral Analysis of Vertical Temperature Profile Time-Series Data in Yellowstone Lake Sediments. Water Resources Research, 57(4), e2020WR028430. [https://doi.org/10.1029/2020WR028430 doi: 10.1029/2020WR028430]. [https://agupubs.onlinelibrary.wiley.com/doi/epdf/10.1029/2020WR028430 Open Access Article]</ref>. VFLUX analytical solutions are limited by subsurface heterogeneity and diurnal temperature signal strength<ref name=”Irvine2017b”/>. [https://data.usgs.gov/modelcatalog/model/82fe0c15-97f5-4f6a-b389-b90f9bad615e 1DTempPro] (Figure 4c) provides a graphical user interface (GUI) for numerical solutions to heat transport<ref>Koch, F. W., Voytek, E. B., Day-Lewis, F. D., Healy, R., Briggs, M. A., Werkema, D., Lane Jr., J. W., 2015. 1DTempPro: A Program for Analysis of Vertical One-Dimensional (1D) Temperature Profiles v2.0. U.S. Geological Survey Software Release. [http://dx.doi.org/10.5066/F76T0JQS doi: 10.5066/F76T0JQS]. [https://data.usgs.gov/modelcatalog/model/82fe0c15-97f5-4f6a-b389-b90f9bad615e Free Download from USGS]</ref> and does not depend on diurnal signals. Numerical models can produce more accurate flux estimates in the case of complex boundary conditions and abrupt changes in flux rates, but require significant user calibration efforts for longer time series<ref name=”McAliley2022”> McAliley, W. A., Day-Lewis, F. D., Rey, D., Briggs, M. A., Shapiro, A. M., Werkema, D., 2022. Application of Recursive Estimation to Heat Tracing for Groundwater/Surface-Water Exchange. Water Resources Research, 58(6), e2021WR030443. [https://doi.org/10.1029/2021WR030443 doi: 10.1029/2021WR030443]. [https://agupubs.onlinelibrary.wiley.com/doi/epdf/10.1029/2021WR030443 Open Access Article]</ref>. A hybrid approach between the analytical and numerical solutions, known as [https://www.sciencebase.gov/catalog/item/60a55c71d34ea221ce48b9e7 tempest1d]<ref name=”McAliley2022”/> improves flux modeling with enhanced computational efficiency, resolution of abrupt changes, evaluation of complex boundary conditions, and uncertainty estimations with each step. This new state-space modeling approach uses recursive estimation techniques to automatically estimate highly dynamic vertical flux patterns ranging from sub-daily to seasonal time scales<ref name=”McAliley2022”/>.
| + | '''Indoor air source screening''' seeks to locate and remove indoor air sources<ref>Doucette, W.J., Hall, A.J., Gorder, K.A., 2010. Emissions of 1,2-Dichloroethane from Holiday Decorations as a Source of Indoor Air Contamination. Ground Water Monitoring and Remediation, 30(1), pp. 67-73. [https://doi.org/10.1111/j.1745-6592.2009.01267.x doi: 10.1111/j.1745-6592.2009.01267.x] </ref> that might confound building specific VI pathway assessment. Visual inspections and written surveys might or might not identify significant indoor air sources, so these should be complemented with use of portable analytical instruments<ref>McHugh, T., Kuder, T., Fiorenza, S., Gorder, K., Dettenmaier, E., Philp, P., 2011. Application of CSIA to Distinguish Between Vapor Intrusion and Indoor Sources of VOCs. Environmental Science and Technology, 45(14), pp. 5952-5958. [https://doi.org/10.1021/es200988d doi: 10.1021/es200988d]</ref><ref name="BeckleyEtAl2014">Beckley, L., Gorder, K., Dettenmaier, E., Rivera-Duarte, I., McHugh, T., 2014. On-Site Gas Chromatography/Mass Spectrometry (GC/MS) Analysis to Streamline Vapor Intrusion Investigations. Environmental Forensics, 15(3), pp. 234–243. [https://doi.org/10.1080/15275922.2014.930941 doi: 10.1080/15275922.2014.930941]</ref>. |
| | | | |
| − | ===Electrical Conductivity (EC) Based Technologies===
| + | The advantage of portable analytical tools is that they allow practitioners to expeditiously test indoor air concentrations under natural conditions in each room of the building. Concentrations in any room in excess of relevant screening levels trigger more sampling in that room to identify if an indoor source is present in that room. Removal of a suspected source and subsequent room testing can identify if that object or product was the source of the previously measured concentrations. |
| − | The electrical conductivity (EC)-based technologies exploit contrasts in EC between surface water and groundwater<ref>Cox, M. H., Su, G. W., Constantz, J., 2007. Heat, Chloride, and Specific Conductance as Ground Water Tracers near Streams. Groundwater, 45(2), pp. 187–195. [https://doi.org/10.1111/j.1745-6584.2006.00276.x doi: 10.1111/j.1745-6584.2006.00276.x].</ref>. EC-based technologies are mostly applied as characterization tools, although the opportunity to monitor GWSWE dynamics with one of these technologies does exist. With the exception of specific conductance probes, the technologies measure the bulk EC of sediments, which will often (but not always) reveal evidence of GWSWE. | |
| | | | |
| − | Electrical conduction (i.e., the transport of charges) in the Earth occurs via the ions dissolved in groundwater, with an additional contribution from ions in the electrical double layer (known as surface conduction)<ref name=”Binley2020”>Binley, A., Slater, L., 2020. Resistivity and Induced Polarization: Theory and Applications to the Near-Surface Earth. Cambridge University Press. [https://doi.org/10.1017/9781108685955 doi: 10.1017/9781108685955].</ref>. In relatively fresh surface water environments, groundwater is typically more electrically conductive than surface water due to the higher ion concentrations in groundwater. In these settings, groundwater inputs may be identified as zones of higher bulk EC beneath the bed. In coastal settings where surface water is saline, inputs of relatively fresh groundwater will give rise to zones of lower conductivity. Whereas the temperature-based methods rely on point measurements at the location of the sensor, the EC-based technologies
| + | '''Building-specific controlled pressurization method (CPM) testing''' directly measures the worst case indoor air impact, but it can also be used to determine contributing VI pathways and to identify indoor air sources<ref>McHugh, T.E., Beckley, L., Bailey, D., Gorder, K., Dettenmaier, E., Rivera-Duarte, I., Brock, S., MacGregor, I.C., 2012. Evaluation of Vapor Intrusion Using Controlled Building Pressure. Environmental Science and Technology, 46(9), pp. 4792–4799. [https://doi.org/10.1021/es204483g doi: 10.1021/es204483g]</ref><ref name="BeckleyEtAl2014" /><ref name="GuoEtAl2015" /><ref name="HoltonEtAl2015">Holton, C., Guo, Y., Luo, H., Dahlen, P., Gorder, K., Dettenmaier, E., Johnson, P.C., 2015. Long-Term Evaluation of the Controlled Pressure Method for Assessment of the Vapor Intrusion Pathway. Environmental Science and Technology, 49(4), pp. 2091–2098. [https://doi.org/10.1021/es5052342 doi: 10.1021/es5052342]</ref><ref name="JohnsonEtAl2020" /><ref name="GuoEtAl2020a">Guo, Y., Dahlen, P., Johnson, P.C., 2020a. Development and Validation of a Controlled Pressure Method Test Protocol for Vapor Intrusion Pathway Assessment. Environmental Science and Technology, 54(12), pp. 7117-7125. [https://dx.doi.org/10.1021/acs.est.0c00811 doi: 10.1021/acs.est.0c00811]</ref>. In CPM testing, blowers/fans installed in a doorway(s) or window(s) are set-up to exhaust indoor air to outdoor, which causes the building to be under pressurized relative to the atmosphere. This induces air movement from the subsurface into the test building via openings in the foundation and/or subsurface piping networks with or without direct connections to indoor air. This is similar to what happens intermittently under natural conditions when wind, indoor-outdoor temperature differences, and/or use of appliances that exhaust air from the structure (e.g. dryer exhaust) create an under-pressurized building condition. |
| − | (with the exception of point specific conductance measurements) incorporate inverse modeling to estimate distributions of EC away from the sensors and beneath the bed. Consequently, these technologies may also image losses of surface water to groundwater<ref>Johnson, T. C., Slater, L. D., Ntarlagiannis, D., Day-Lewis, F. D., Elwaseif, M., 2012. Monitoring Groundwater-Surface Water Interaction Using Time-Series and Time- Frequency Analysis of Transient Three-Dimensional Electrical Resistivity Changes. Water Resources Research, 48(7). [https://doi.org/10.1029/2012WR011893 doi: 10.1029/2012WR011893]. [https://agupubs.onlinelibrary.wiley.com/doi/epdf/10.1029/2012WR011893 Open Access Article]</ref>. Another advantage is that they may provide information on structural controls on zones of focused GWSWE expressed at the surface. However, interpretation of EC patterns from these technologies is inherently uncertain due to the fact that (with the exception of specific conductance probes) the bulk EC of the sediments is measured. Variations in lithology (e.g., porosity, grain size distribution, which determine the strength of surface conduction) can be misinterpreted as variations in the ionic composition of groundwater.
| |
| | | | |
| − | ====Characterization Methods====
| + | The blowers/fans can also be used to blow outdoor air into the building, thereby creating a building over-pressurization condition. A positive pressure difference CPM test suppresses VI pathways; therefore, chemicals detected in indoor air above outdoor air concentrations during this condition are attributed to indoor contaminant sources which facilitates the identification of any such indoor air sources. |
| | | | |
| − | =====''Specific Conductance Probes''=====
| + | Data collected during CPM testing, when combined with screening level VI modeling, can be used to identify which VI chemical migration pathways are significant contributors to indoor air impacts<ref name="GuoEtAl2015" />. CPM testing guidelines were developed and validated under ESTCP Project ER-201501<ref name="GuoEtAl2020a" /><ref name="JohnsonEtAl2021" />. |
| − | The simplest EC-based technology is a specific conductance probe, which measures the specific conductance of water between a small pair of metal plates at the end of the sensor probe. Many commercially available water quality sensors have a specific conductance sensor and a temperature sensor integrated into a single probe (they often also measure other water quality parameters, including pH and dissolved oxygen (DO) content). These are direct sensing measurements with a small footprint (the size of the sensor), so this is usually a time-consuming, inefficient method for detecting GWSWE dynamics. Furthermore, the sampling volume of the measurement is small (on the order of a cubic centimeter or less), so the degree to which the spot measurement is representative of larger-scale hydrological exchanges is often uncertain. However, specific conductance sensor remains popular, especially when integrated with a point temperature sensor, such as the [https://clu-in.org/programs/21m2/navytools/gsw/#trident Trident Probe].
| |
| | | | |
| − | =====''Frequency Domain Electromagnetic (EM) Sensing Systems''=====
| + | '''Passive samplers''' can be used to measure long term average indoor air concentrations under natural conditions and during VI mitigation system operation. They will provide more confident assessment of long term average concentrations than an infrequent sequence of short term grab samples. Long term average concentrations can also be determined by long term active sampling (e.g., by slowly pulling air through a thermal desorption (TD) tube). However, passive sampling has the advantage that additional equipment and expertise is not required for sampler deployment and recovery. |
| − | [[File:IeryFig5.png |thumb|600px|Figure 5. (a) FDEM survey path within a stream/drainage channel network bisecting a wetland complex experiencing localized upwelling of contaminated groundwater (b) operation of an FDEM sensor (Dualem 421S, Dualem, CA) in this shallow stream environment (c) resulting imaging of EC structure in the upper 6 m of streambed sediments. Variations in EC may result from changes in sediment texture that determine the location of focused GWSWE. Dataset acquired under ESTCP project ER21-5237.]]
| |
| − | Electromagnetic (EM) sensors non-invasively sense the bulk EC of sediments (a function of both fluid composition and lithology as mentioned above) by measuring eddy currents induced in conductors using time varying electric and magnetic fields based on the physics of electromagnetic induction. Modern EM systems can simultaneously image across a range of depths. Frequency domain EM (FDEM) instruments generate a current that varies sinusoidally with time at a fixed frequency that is selected on the basis of desired exploration depth and resolution. State of the art FDEM sensors use a combination of different coil separations and/or frequencies to resolve conductivity structure over a range of depths. These instruments typically provide high-resolution (sub-meter) information on the EC structure in the upper 5 m (approximately, depending on EC) of the subsurface. Measurements are non-invasively and continuously made, meaning that large areas can be quickly surveyed on foot (e.g., along a shoreline) or from a boat in shallow water (1 m or less deep), for example when pulled along a river or stream channel. The method can also be deployed effectively in wetlands (Figure 5). FDEM data are often presented in terms of variations in the raw measurements because apparent EC values do not represent the true EC of the subsurface. However, with the increasing popularity of sensors with combinations of coil separations, the datasets can be inverted to obtain a model of the distribution of the true EC of the subsurface on land or below a water layer. Inversion of FDEM datasets is usually performed as a series of one-dimensional (1D) models, constrained to have a limited variance from each other, to generate a pseudo-2D model of the subsurface. Open-source software, such as [https://hkex.gitlab.io/emagpy/ EMagPy]<ref>McLachlan, P., Blanchy, G., Binley, A., 2021. EMagPy: Open-Source Standalone Software for Processing, Forward Modeling and Inversion of Electromagnetic Induction Data. Computers and Geosciences, 146, 104561. [https://doi.org/10.1016/j.cageo.2020.104561 doi: 10.1016/j.cageo.2020.104561].</ref>, is freely available to manage, visualize and interpret FDEM datasets.
| |
| | | | |
| − | =====''Time Domain EM Sensing Systems''=====
| + | Use of passive samplers in indoor air under time-varying concentration conditions was demonstrated and validated by comparing against intensive active sampling in ESTCP Project ER-201501<ref name="JohnsonEtAl2020" /><ref name="GuoEtAl2021">Guo, Y., O’Neill, H., Dahlen, P., and Johnson, P.C. 2021. Evaluation of Passive Diffusive-Adsorptive Samplers for Use in Assessing Time-Varying Indoor Air Impacts Resulting from Vapor Intrusion. Groundwater Monitoring and Remediation, 42(1), pp. 38-49. [https://doi.org/10.1111/gwmr.12481 doi: 10.1111/12481]</ref>. |
| − | Time domain EM (TEM) systems transmit a current that is abruptly shut off (reduced to zero), resulting in a transient current flow that propagates (with decaying amplitude) into the earth. The time-decaying voltage recorded in a receiver coil contains information on the EC variation with depth below the instrument. TEM systems specifically designed for waterborne surveys provide investigation depths up to 70 m (again depending on electrical conductivity)<ref>Lane Jr., J. W., Briggs, M. A., Maurya, P. K., White, E. A., Pedersen, J. B., Auken, E., Terry, N., Minsley, B., Kress, W., LeBlanc, D. R., Adams, R., Johnson, C. D., 2020. Characterizing the Diverse Hydrogeology Underlying Rivers and Estuaries Using New Floating Transient Electromagnetic Methodology. Science of the Total Environment, 740, 140074. [https://doi.org/10.1016/j.scitotenv.2020.140074 doi: 10.1016/j.scitotenv.2020.140074]. [https://pdf.sciencedirectassets.com/271800/1-s2.0-S0048969720X00313/1-s2.0-S0048969720335944/am.pdf?X-Amz-Security-Token=IQoJb3JpZ2luX2VjEFIaCXVzLWVhc3QtMSJIMEYCIQDZ%2B%2FCGoVTTeSPFPtk4OW69PC4KEHqVkJKlXr53AsvHdQIhAPZN6QAcBxRTVXEK7JzdlztbyC0YCiI8uy0GY9A0rXePKrwFCPr%2F%2F%2F%2F%2F%2F%2F%2F%2F%2FwEQBRoMMDU5MDAzNTQ2ODY1IgwE9HI9XVU0l%2BzWSuoqkAXE3X7NIZ%2F%2FdOJUm0fUfbE9sV8pySpOwYC0486IvtPPTBowSKFbx3vAcqacG%2B6VAiPUlQJIbXyY10TtNJIVamtrdqKawz6kL9JuuoFesHagWsbHUu8xE0ZcEoSRoD%2Btocg7XxHtfdRC0cEM%2F6VDcKQg1h4j4Ak%2FrS2SJAvt0OmlvNNIXEp87MhMP7VU%2BTm788JJKs2VDuRNaz%2BoQ4W%2FpXpB5PxIB%2FvW55DtjmdUOTGB0d5Kwq1QTrX0z02SD3GaQFHvVlmwVtNbswzqgzLA%2BiHzqG9ZzmEqxJL8%2F%2F%2F9ZYahtdXZPWTTF0MqwAjskmy7aZoqn6H7bhO4tmQpgFLcVhkufPQkObVxTmCcSOUweT6yHq1K%2FysQrY9ba%2F6qCVFR2AhCvccsn0jTPVeMDhUkP0EAOZt3d4JvL9ZvViFh4WLjM69jB%2BBqXyhUEsOdPVC76RMMYWYtEhJq6bFKyAKX6VwvOnzoIcHxVuxa0ulPfshyymwNyeyXF30xrWDyUU10W5mThgljbwI1WWPubRFDCKiyuaEAJfMNZCM8I%2B8DaFm4qEpqgzOu28W0GnHova%2BLNza5yTpmNGZDRstWNTTeaE4VhgBuaLUc6TB0j7sH9yO5q5UOTqv4GN3X6w5GG758i7TgnNQPV5yjG%2Foyl46OgsVbq8ALyKvSFNYJeDS0Hv1s7pbwGHKi%2F7kZoOo30oLpN%2F8m1n5HYj%2Bxz7nkgzB5z7aelBYZERf3TypQaXlRiS%2FLgiqi6KzAsAKo07Mjn0lZNmTCrb7nsf3dPh2phYcVSRjSSZ4qTzF02Jc1kSHWGgNrt%2BaGRj2p%2FyNI%2Fb3WrvXffMSJ%2FpJfWJofKMlQP96TWBJt2mRZ6F6U5gWE4J5Dn%2BI8HTDduaytBjqwAf%2FpCFEnbS3RfOQ64c16pUa%2BCsCwOWuWoxV7sDyHaPuoDmfpmHbBMMQaUKp4iqCrDesa1Np01xsxOW6dUEHE9A2SmIS0eRtttMuf%2ByCQL8dXg3e5ptGM9VNkwpflS2rEpCCyDWN0rWMs7Dkzw232XzO9kR6ZNO5BJnQy1SOqoYn9kBTbY%2F6C0Nw3rkFIi%2FFHjxdyHk7pO0jf4p5graNK2kOB54cXa5PY5OcRRcv2irwk&X-Amz-Algorithm=AWS4-HMAC-SHA256&X-Amz-Date=20240120T014358Z&X-Amz-SignedHeaders=host&X-Amz-Expires=300&X-Amz-Credential=ASIAQ3PHCVTY3WJS7ASS%2F20240120%2Fus-east-1%2Fs3%2Faws4_request&X-Amz-Signature=5780b8a5381ef60b05df0e480b9c6d222c334b1d738bac8f9df7c3ae0b27fe59&hash=bcff28fddb45f4ac782f40fcc311db617d06d21300beb12018d4810d1baca112&host=68042c943591013ac2b2430a89b270f6af2c76d8dfd086a07176afe7c76c2c61&pii=S0048969720335944&tid=pdf-2543cf95-ab24-4e83-9d62-963bcb00db35&sid=27b3c4ac266c74410d0954f-878848e7f20agxrqa&type=client Open Access Manuscript]</ref>. Airborne TEM systems can also be deployed to look at large-scale surface water/groundwater dynamics, for example submarine discharge or saline intrusion along coastlines<ref>d’Ozouville, N., Auken, E., Sorensen, K., Violette, S., de Marsily, G., Deffontaines, B., Merlen, G., 2008. Extensive Perched Aquifer and Structural Implications Revealed by 3D Resistivity Mapping in a Galapagos Volcano. Earth and Planetary Science Letters, 269(3–4), pp. 518–522. [https://doi.org/10.1016/j.epsl.2008.03.011 doi: 10.1016/j.epsl.2008.03.011].</ref>. Inverse methods are employed to convert the raw measurements obtained along a transect into a distribution of conductivity.
| |
| | | | |
| − | =====''Waterborne Electrical Imaging''=====
| + | The purpose of maintaining an evergreen '''comprehensive VI conceptual model''' is to ensure that the most complete and up-to-date understanding of the site is informing decisions related to future sampling, data interpretation, and the need for and design of mitigation systems. The VI conceptual model can also serve as an effective communication tool in stakeholder discussions. |
| − | [[File:IeryFig6.png |thumb|600px|left|Figure 6. Waterborne electrical imaging in a coastal setting with expected zones of upwelling groundwater (a) typical operation with floating electrode cable pulled behind boat (b) inverted 2D cross section of electrical resistivity along the survey path with possible zones of fresh groundwater discharges indicated from relatively high resistivity sediments. Dataset acquired under ESTCP project ER21-5237.]]
| |
| − | Electrical imaging techniques are based on galvanic (direct) contact between electrodes used to inject currents (and measure voltages) and the subsurface<ref name=”Binley2020”/>. Relative to EM methods, this can be a disadvantage when surveying on land. However, when making measurements from a water body, the electrodes used to acquire the data can be deployed as a floating array that is pulled behind a vessel. Waterborne electrical imaging relies on acquiring measurements of electrical potential differences between different pairs of electrodes on the array while current is passed between one pair of electrodes<ref>Day-Lewis, F. D., White, E. A., Johnson, C. D., Lane Jr, J. W., Belaval, M., 2006. Continuous Resistivity Profiling to Delineate Submarine Groundwater Discharge—Examples and Limitations. The Leading Edge, 25(6), pp. 724–728. [https://doi.org/10.1190/1.2210056 doi: 10.1190/1.2210056]</ref>. As the array is pulled behind the boat, thousands of measurements are made along a survey transect. Similar to the EM methods, inverse methods are used to process these datasets and generate a 2D image of the variation in the conductivity of the sediments below the bed. Open-source software such as [https://hkex.gitlab.io/resipy/ ResIPy] support 2D or 3D inversion of waterborne datasets. Figure 6 shows results of a waterborne electrical imaging survey conducted to locate regions where relative fresh (electrically resistive) groundwater is discharging into the near shore environment in a coastal setting. Beneath the saline (low resistivity) water layer, spatial variability in resistivity may partly be related to variations in the pore-filling fluid conductivity, with localized resistive zones possibly indicating upwelling fresh groundwater. However, the variation in resistivity in the sediments below the water layer may reflect variations in lithology. An extension of the electrical imaging method involves collecting induced polarization (IP) data<ref name=”Binley2020”/> in addition to electrical resistivity data. IP measurements capture the temporary charge storage characteristics of the subsurface, which are strongly controlled by lithology, with finer-grained (e.g. clay rich) sediments being more chargeable than coarser grained sediments. The method can be particularly useful for differentiating between conductivity variations resulting from variations in pore fluid specific conductance and those conductivity variations associated with lithology. For example, based on electrical imaging methods alone (or the EM method alone), it may not be possible to distinguish a zone of high specific conductance groundwater entering into freshwater from a region of relatively finer- grained sediments without additional supporting data (e.g. a core). IP measurements may be able to resolve this ambiguity as the region of finer-grained sediments will be more chargeable than the surrounding areas.
| |
| | | | |
| − | ====Monitoring Methods====
| + | Use of these tools for residential neighborhoods and in non-residential buildings overlying chlorinated solvent groundwater plumes is documented comprehensively in a series of peer reviewed articles<ref name="JohnsonEtAl2020" /><ref name="JohnsonEtAl2021" /><ref name="JohnsonEtAl2022" /><ref name="GuoEtAl2015" /><ref name="GuoEtAl2020a" /><ref name="GuoEtAl2020b">Guo, Y., Dahlen, P., Johnson, P.C. 2020b. Temporal variability of chlorinated volatile organic compound vapor concentrations in a residential sewer and land drain system overlying a dilute groundwater plume. Science of the Total Environment, 702, Article 134756. [https://doi.org/10.1016/j.scitotenv.2019.134756 doi: 10.1016/j.scitotenv.2019.134756] [//www.enviro.wiki/images/e/e5/GuoEtAl2020b.pdf Open Access Manuscript]</ref><ref name="GuoEtAl2021" /><ref name="HoltonEtAl2015" />. |
| − | | |
| − | =====''Land-based Electrical Monitoring''=====
| |
| − | There is increasing interest in the use of electrical imaging methods as monitoring systems. Semi-permanent arrays of electrodes can be installed to monitor groundwater/surface water dynamics over periods of days to years. Low-power instrumentation has been developed to specifically address the needs for long-term monitoring, although such instrumentation is not yet commercially available. Consequently, electrical monitoring of groundwater/surface water interactions currently remains in the realm of the research-driven specialist.
| |
| − | | |
| − | ===Considerations for Using EM and Waterborne Electrical Imaging Methods===
| |
| − | The EM and waterborne electrical imaging methods both provide a way to determine variations in bulk electrical conductivity associated with groundwater/surface water interactions. However, each method has some advantages and some disadvantages. One consideration is maneuverability, particularly in shallow water environments. FDEM instruments are the most maneuverable, although they offer only limited investigation depths. Although bigger than the shallow-sensing frequency domain EM systems, TEM systems are still relatively maneuverable on water bodies. Whereas FDEM systems can be operated from a single small vessel, the TEM deployments require the use of pontoons as the transmitter and receiver coils need to be separated 9 m apart. This still equates to good maneuverability compared to waterborne electrical imaging where a floating electrode cable, typically 30-50 m long, is pulled behind a vessel.
| |
| − | | |
| − | In all three methods, variations in the water layer depth and the specific conductance of the water can significantly affect the data, especially in deeper water. Therefore, it is common to continuously record these parameters with an echo sounder and a specific conductance probe suspended in the water layer.
| |
| − | | |
| − | ===Other Hydrogeophysical Technologies=== | |
| − | A number of other hydrogeophysical technologies exist, with proven applications to the characterization of settings where GWSWE occurs. Seismic [[Wikipedia:Reflection seismology | reflection]] and [[Wikipedia:Seismic refraction | refraction]] methods are used to image the depositional environments along coastlines. [[Wikipedia:Ground-penetrating radar | Ground penetrating radar]] has been effectively used to image depositional environments around freshwater lake shorelines, and across streams and rivers. Such information may help to identify depositional features that promote GWSWE but, unlike the temperature- and conductivity-based methods, do not sense changes in physical properties associated with the exchanging water itself.
| |
| − | | |
| − | One promising technique for detecting GWSWE is known as the [https://www.epa.gov/environmental-geophysics/self-potential-sp self-potential (SP)] method. This simple to deploy geophysical technique is based on mapping voltage differences caused by natural sources of electric current in the Earth that are generated through a number of coupled flow processes, one being the coupling of pore fluid flow and transport of electric charge. Zones of enhanced seepage within a porous medium can result in a significant ‘streaming potential’ due to charge transport induced by fluid flow. This phenomenon has been effectively used to locate zones of leakage through dams and embankments<ref>Panthulu, T. V, Krishnaiah, C., Shirke, J. M., 2001. Detection of Seepage Paths in Earth Dams Using Self-Potential and Electrical Resistivity Methods. Engineering Geology, 59(3-4), pp. 281–295. [https://doi.org/10.1016/S0013-7952(00)00082-X doi: 10.1016/S0013-7952(00)00082-X].</ref>. Recently, floating SP measurements have been used to define gaining and losing portions of streams and to identify evidence of focused exchange<ref>Ikard, S. J., Teeple, A. P., Payne, J. D., Stanton, G. P., Banta, J. R., 2018. New Insights On Scale-Dependent Surface-Groundwater Exchange from a Floating Self-Potential Dipole. Journal of Environmental and Engineering Geophysics, 23(2), pp. 261–287. [https://doi.org/10.2113/JEEG23.2.261 doi: 10.2113/JEEG23.2.261].</ref>. Although the data acquisition is simple, consisting of a pair of non-polarizing electrodes and a voltmeter, the interpretation of SP measurements requires expert knowledge to filter out confounding contributions to the recorded signals.
| |
| − | | |
| − | ==Guidelines for Implementing Hydrogeophysical Methods into Groundwater/Surface Water Interaction Studies==
| |
| − | A number of factors will affect the success of individual hydrogeophysical methods at a specific
| |
| − | site of GWSWE. Depending on site conditions and the objective, some methods may be inappropriate to deploy. For example, temperature-based methods will most likely succeed at times of the year and times of day when contrasts between upwelling groundwater and surface water are greatest. In contrast, it is quite possible that some sites of groundwater/surface water exchange will have an insufficient contrast in the specific conductance of the groundwater versus the surface water to make techniques based on EC measurements effective. A groundwater-surface water method selection tool ([https://water.usgs.gov/water-resources/software/GW-SW-MST/ GW/SW-MST]<ref>Hammett, S., Day-Lewis, F. D., Trottier, B., Barlow, P. M., Briggs, M. A., Delin, G., Harvey, J. W., Johnson, C. D., Lane jr., J. W., Rosenberry, D. O., Werkema, D. D., 2022. GW/SW-MST: A Groundwater/Surface-Water Method Selection Tool. Groundwater, 60(6), pp. 784-791. [https://doi.org/10.1111/gwat.13194 doi: 10.1111/gwat.13194]. [https://ngwa.onlinelibrary.wiley.com/doi/am-pdf/10.1111/gwat.13194 Open Access Manuscript]</ref>) has recently been developed to assist practitioners in the informed selection of the methods that will be most effective for a particular site at a particular time. The tool guides the user through a series of questions that consider both the specific conditions at the site and the primary objectives of the investigation. The methods selection tool discusses the application of a number of additional technologies besides those included in this article. The selection tool is recommended as the starting point for any practitioner.
| |
| | | | |
| | ==Summary== | | ==Summary== |
| − | A number of temperature-based and electrical conductivity-based technologies exist for monitoring GWSWE over a range of spatial scales. Many of these technologies are most powerful when used as reconnaissance tools to rapidly identify probable locations of GWSWE to be verified with a limited campaign of direct sensing measurements (traditionally seepage meters). Vertical temperature profilers (VTPs) offer direct quantification of fluxes at sites identified by the reconnaissance tools, and some studies show that these methods are more reliable than traditional seepage meters. Given the number of sites across the globe where contaminated groundwater is impacting surface water resources, use of these technologies for both characterization and monitoring is expected to become more common.
| + | In summary, the VI Diagnosis Toolkit provides a set of tools that can lead to quicker, more confident, and more cost effective neighborhood-scale VI pathway and impact assessments. Toolkit components and their use can complement conventional methods for assessing and mitigating the vapor intrusion pathway. |
| | | | |
| | ==References== | | ==References== |
| Line 115: |
Line 83: |
| | | | |
| | ==See Also== | | ==See Also== |
| − | USGS Water Resources:
| |
| − | * https://www.usgs.gov/mission-areas/water-resources/science/geophysics-usgs-groundwatersurface-water-exchange-studies
| |
| − |
| |
| − | * https://www.usgs.gov/mission-areas/water-resources/science/thermal-imaging-cameras-studying-groundwatersurface-water
| |
| − |
| |
| − | * https://www.usgs.gov/mission-areas/water-resources/science/fiber-optic-distributed-temperature-sensing-technology
| |
| | | | |
| − | * https://www.usgs.gov/mission-areas/water-resources/science/integration-suas-hydrogeophysical-studies | + | *[https://papers.ssrn.com/sol3/papers.cfm?abstract_id=4000681 Evaluation of Radon and Building Pressure Differences as Environmental Indicators for Vapor Intrusion Assessment] |
| | + | *[https://pubs.acs.org/doi/10.1021/es4024767 Temporal Variability of Indoor Air Concentrations under Natural Conditions in a House Overlying a Dilute Chlorinated Solvent Groundwater Plume] |
| | + | *[https://serdp-estcp.mil/projects/details/e0d00662-c333-4560-8ae7-60f20b0e714b Integrated Field-Scale, Lab-Scale, and Modeling Studies for Improving Our Ability to Assess the Groundwater to Indoor Air Pathway at Chlorinated Solvent Impacted Sites] |
Assessing Vapor Intrusion (VI) Impacts in Neighborhoods with Groundwater Contaminated by Chlorinated Volatile Organic Chemicals (CVOCs)
The VI Diagnosis Toolkit[1] is a set of tools that can be used individually or in combination to assess vapor intrusion (VI) impacts at one or more buildings overlying regional-scale dissolved chlorinated solvent impacted groundwater plumes. The strategic use of these tools can lead to confident and efficient neighborhood-scale VI pathway assessments.
Related Article(s):
Contributor(s):
- Paul C. Johnson, Ph.D.
- Paul Dahlen, Ph.D.
- Yuanming Guo, Ph.D.
Key Resource(s):
- The VI Diagnosis Toolkit for Assessing Vapor Intrusion Pathways and Impacts in Neighborhoods Overlying Dissolved Chlorinated Solvent Plumes, ESTCP Project ER-201501, Final Report[1]
- CPM Test Guidelines: Use of Controlled Pressure Method Testing for Vapor Intrusion Pathway Assessment, ESTCP Project ER-201501, Technical Report[2]
- VI Diagnosis Toolkit User Guide, ESTCP Project ER-201501[3]
Introduction
Most federal, state, and local regulatory guidance for assessing and mitigating the vapor intrusion pathway reflects USEPA’s Technical Guide for Assessing and Mitigating the Vapor Intrusion Pathway from Subsurface Vapor Sources to Indoor Air[4]. The paradigm outlined by that guidance includes: 1) a preliminary and mostly qualitative analysis that looks for site conditions that suggest vapor intrusion might occur (e.g., the presence of vapor-forming chemicals in close proximity to buildings); 2) a multi-step and more detailed quantitative screening analysis that involves site-specific data collection and their comparison to screening levels to identify buildings of potential VI concern; and 3) selection and design of mitigation systems or continued monitoring, as needed. With respect to (2), regulatory guidance typically recommends consideration of “multiple lines of evidence” in decision-making[4][5], with typical lines-of-evidence being groundwater, soil gas, sub-slab soil gas, and/or indoor air concentrations. Of those, soil gas measurements and/or measured short-term indoor air concentrations can be weighted heavily, and therefore decision making might not be completed without them. Effective evaluation of VI risk from sub-slab and/or soil gas measurements would require an unknown building-specific attenuation factor, but there is also uncertainty as to whether or not indoor air data is representative of maximum and/or long-term average indoor concentrations. Indoor air data can be confounded by indoor contaminant sources because the number of samples is typically small, indoor concentrations can vary with time, and because a number of household products can emit the chemicals being measured. When conducting VI pathway assessments in neighborhoods where it is impractical to assess all buildings, the EPA recommends following a “worst first” investigational approach.
The limitations of this approach, as practiced, are the following:
- Decisions are rarely made without indoor air data and generally, seasonal sampling is required, delaying decision making.
- The collection of a robust indoor air data set that adequately characterizes long term indoor air concentrations could take years given the typical frequency of data collection and the most common methods of sample collection (e.g., 24-hour samples). Therefore, indoor air sampling might continue indefinitely at some sites.
- The “worst first” buildings might not be identified correctly by the logic outlined in USEPA’s 2015 guidance and the most impacted buildings might not even be located over a groundwater plume. Recent studies have shown VI impacts in homes as a result of sewer and other subsurface piping connections, which are not explicitly considered nor easily characterized through conventional VI pathway assessment[6][7][8][9][10].
- The presumptive remedy for VI mitigation (sub-slab depressurization) may not be effective for all VI scenarios (e.g., those involving vapor migration to indoor spaces via sewer connections).
The VI Diagnosis Toolkit components were developed considering these limitations as well as more recent knowledge gained through research, development, and validation projects funded by SERDP and ESTCP.
The VI Diagnosis Toolkit Components
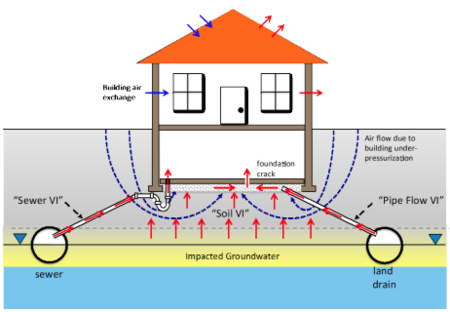
Figure 1. Vapor intrusion pathway conceptualization considering “alternate VI pathways”, including “pipe flow VI” and “sewer VI” pathways
[1].
The primary components of the VI Diagnosis Toolkit and their uses include:
- External VI source strength screening to identify buildings most likely to be impacted by VI at levels warranting building-specific testing.
- Indoor air source screening to locate and remove indoor air sources that might confound building specific VI pathway assessment.
- Controlled pressurization method (CPM) testing to quickly (in a few days or less) measure the worst-case indoor air impact likely to be caused by VI under natural conditions in specific buildings. CPM tests can also be used to identify the presence of indoor air sources and diagnose active VI pathways.
- Passive indoor sampling for determining long-term average indoor air concentrations under natural VI conditions and/or for verifying mitigation system effectiveness in buildings that warrant VI mitigation.
- Comprehensive VI conceptual model development and refinement to ensure that appropriate monitoring, investigation, and mitigation strategies are being selected (Figure 1).
Expanded discussions for each of these are given below.
External VI source strength screening identifies those buildings that warrant more intrusive building-specific assessments, using data collected exterior to the buildings. The use of groundwater and/or soil gas concentration data for building screening has been part of VI pathway assessments for some time and their use is discussed in many regulatory guidance documents. Typically, the measured concentrations are compared to relevant screening levels derived via modeling or empirical analyses from indoor air concentrations of concern.
More recently it has been discovered that VI impacts can occur via sewer and other subsurface piping connections in areas where vapor migration through the soil would not be expected to be significant, and this could also occur in buildings that do not sit over contaminated groundwater[10][7][8][9].
Therefore, in addition to groundwater and soil gas sampling, external data collection that includes and extends beyond the area of concern should include manhole vapor sampling (e.g., sanitary sewer, storm sewer, land-drain). Video surveys from sanitary sewers, storm sewers, and/or land-drains can also be used to identify areas of groundwater leakage into utility corridors and lateral connections to buildings that are conduits for vapor transport. During these investigations, it is important to recognize that utility corridors can transmit both impacted water and vapors beyond groundwater plume boundaries, so extending investigations into areas adjacent to groundwater plume boundaries is necessary.
Using projected indoor air concentrations from modeling and empirical data analyses, and distance screening approaches, external source screening can identify areas and buildings that can be ruled out, or conversely, those that warrant building-specific testing.
Demonstration of neighborhood-scale external VI source screening using groundwater, depth, sewer, land drain, and video data is documented in the ER-201501 final report[1].
Indoor air source screening seeks to locate and remove indoor air sources[11] that might confound building specific VI pathway assessment. Visual inspections and written surveys might or might not identify significant indoor air sources, so these should be complemented with use of portable analytical instruments[12][13].
The advantage of portable analytical tools is that they allow practitioners to expeditiously test indoor air concentrations under natural conditions in each room of the building. Concentrations in any room in excess of relevant screening levels trigger more sampling in that room to identify if an indoor source is present in that room. Removal of a suspected source and subsequent room testing can identify if that object or product was the source of the previously measured concentrations.
Building-specific controlled pressurization method (CPM) testing directly measures the worst case indoor air impact, but it can also be used to determine contributing VI pathways and to identify indoor air sources[14][13][7][15][1][16]. In CPM testing, blowers/fans installed in a doorway(s) or window(s) are set-up to exhaust indoor air to outdoor, which causes the building to be under pressurized relative to the atmosphere. This induces air movement from the subsurface into the test building via openings in the foundation and/or subsurface piping networks with or without direct connections to indoor air. This is similar to what happens intermittently under natural conditions when wind, indoor-outdoor temperature differences, and/or use of appliances that exhaust air from the structure (e.g. dryer exhaust) create an under-pressurized building condition.
The blowers/fans can also be used to blow outdoor air into the building, thereby creating a building over-pressurization condition. A positive pressure difference CPM test suppresses VI pathways; therefore, chemicals detected in indoor air above outdoor air concentrations during this condition are attributed to indoor contaminant sources which facilitates the identification of any such indoor air sources.
Data collected during CPM testing, when combined with screening level VI modeling, can be used to identify which VI chemical migration pathways are significant contributors to indoor air impacts[7]. CPM testing guidelines were developed and validated under ESTCP Project ER-201501[16][2].
Passive samplers can be used to measure long term average indoor air concentrations under natural conditions and during VI mitigation system operation. They will provide more confident assessment of long term average concentrations than an infrequent sequence of short term grab samples. Long term average concentrations can also be determined by long term active sampling (e.g., by slowly pulling air through a thermal desorption (TD) tube). However, passive sampling has the advantage that additional equipment and expertise is not required for sampler deployment and recovery.
Use of passive samplers in indoor air under time-varying concentration conditions was demonstrated and validated by comparing against intensive active sampling in ESTCP Project ER-201501[1][17].
The purpose of maintaining an evergreen comprehensive VI conceptual model is to ensure that the most complete and up-to-date understanding of the site is informing decisions related to future sampling, data interpretation, and the need for and design of mitigation systems. The VI conceptual model can also serve as an effective communication tool in stakeholder discussions.
Use of these tools for residential neighborhoods and in non-residential buildings overlying chlorinated solvent groundwater plumes is documented comprehensively in a series of peer reviewed articles[1][2][3][7][16][18][17][15].
Summary
In summary, the VI Diagnosis Toolkit provides a set of tools that can lead to quicker, more confident, and more cost effective neighborhood-scale VI pathway and impact assessments. Toolkit components and their use can complement conventional methods for assessing and mitigating the vapor intrusion pathway.
References
- ^ 1.0 1.1 1.2 1.3 1.4 1.5 1.6 Johnson, P.C., Guo, Y., Dahlen, P., 2020. The VI Diagnosis Toolkit for Assessing Vapor Intrusion Pathways and Mitigating Impacts in Neighborhoods Overlying Dissolved Chlorinated Solvent Plumes. ESTCP Project ER-201501, Final Report. Project Website Final Report.pdf
- ^ 2.0 2.1 2.2 Johnson, P.C., Guo, Y., Dahlen, P., 2021. CPM Test Guidelines: Use of Controlled Pressure Method Testing for Vapor Intrusion Pathway Assessment. ESTCP ER-201501, Technical Report. Project Website Technical_Report.pdf
- ^ 3.0 3.1 Johnson, P.C., Guo, Y., and Dahlen, P., 2022. VI Diagnosis Toolkit User Guide, ESTCP ER-201501, User Guide. Project Website User_Guide.pdf
- ^ 4.0 4.1 USEPA, 2015. OSWER Technical Guide for Assessing and Mitigating the Vapor Intrusion Pathway from Subsurface Vapor Sources to Indoor Air. U.S. Environmental Protection Agency, Office of Solid Waste and Emergency Response, OSWER Publication No. 9200.2-154, 267 pages. USEPA Website Report.pdf
- ^ NJDEP, 2021. Vapor Intrusion Technical Guidance, Version 5.0. New Jersey Department of Environmental Protection, Trenton, NJ. Website Guidance Document.pdf
- ^ Beckley, L, McHugh, T., 2020. A Conceptual Model for Vapor Intrusion from Groundwater Through Sewer Lines. Science of the Total Environment, 698, Article 134283. doi: 10.1016/j.scitotenv.2019.134283 Open Access Article
- ^ 7.0 7.1 7.2 7.3 7.4 Guo, Y., Holton, C., Luo, H., Dahlen, P., Gorder, K., Dettenmaier, E., Johnson, P.C., 2015. Identification of Alternative Vapor Intrusion Pathways Using Controlled Pressure Testing, Soil Gas Monitoring, and Screening Model Calculations. Environmental Science and Technology, 49(22), pp. 13472–13482. doi: 10.1021/acs.est.5b03564
- ^ 8.0 8.1 McHugh, T., Beckley, L., Sullivan, T., Lutes, C., Truesdale, R., Uppencamp, R., Cosky, B., Zimmerman, J., Schumacher, B., 2017. Evidence of a Sewer Vapor Transport Pathway at the USEPA Vapor Intrusion Research Duplex. Science of the Total Environment, pp. 598, 772-779. doi: 10.1016/j.scitotenv.2017.04.135 Open Access Manuscipt
- ^ 9.0 9.1 McHugh, T., Beckley, L., 2018. Sewers and Utility Tunnels as Preferential Pathways for Volatile Organic Compound Migration into Buildings: Risk Factors and Investigation Protocol. ESTCP ER-201505, Final Report. Project Website Final Report.pdf
- ^ 10.0 10.1 Riis, C., Hansen, M.H., Nielsen, H.H., Christensen, A.G., Terkelsen, M., 2010. Vapor Intrusion through Sewer Systems: Migration Pathways of Chlorinated Solvents from Groundwater to Indoor Air. Seventh International Conference on Remediation of Chlorinated and Recalcitrant Compounds, May, Monterey, CA. Battelle Memorial Institute. ISBN 978-0-9819730-2-9. Website Report.pdf
- ^ Doucette, W.J., Hall, A.J., Gorder, K.A., 2010. Emissions of 1,2-Dichloroethane from Holiday Decorations as a Source of Indoor Air Contamination. Ground Water Monitoring and Remediation, 30(1), pp. 67-73. doi: 10.1111/j.1745-6592.2009.01267.x
- ^ McHugh, T., Kuder, T., Fiorenza, S., Gorder, K., Dettenmaier, E., Philp, P., 2011. Application of CSIA to Distinguish Between Vapor Intrusion and Indoor Sources of VOCs. Environmental Science and Technology, 45(14), pp. 5952-5958. doi: 10.1021/es200988d
- ^ 13.0 13.1 Beckley, L., Gorder, K., Dettenmaier, E., Rivera-Duarte, I., McHugh, T., 2014. On-Site Gas Chromatography/Mass Spectrometry (GC/MS) Analysis to Streamline Vapor Intrusion Investigations. Environmental Forensics, 15(3), pp. 234–243. doi: 10.1080/15275922.2014.930941
- ^ McHugh, T.E., Beckley, L., Bailey, D., Gorder, K., Dettenmaier, E., Rivera-Duarte, I., Brock, S., MacGregor, I.C., 2012. Evaluation of Vapor Intrusion Using Controlled Building Pressure. Environmental Science and Technology, 46(9), pp. 4792–4799. doi: 10.1021/es204483g
- ^ 15.0 15.1 Holton, C., Guo, Y., Luo, H., Dahlen, P., Gorder, K., Dettenmaier, E., Johnson, P.C., 2015. Long-Term Evaluation of the Controlled Pressure Method for Assessment of the Vapor Intrusion Pathway. Environmental Science and Technology, 49(4), pp. 2091–2098. doi: 10.1021/es5052342
- ^ 16.0 16.1 16.2 Guo, Y., Dahlen, P., Johnson, P.C., 2020a. Development and Validation of a Controlled Pressure Method Test Protocol for Vapor Intrusion Pathway Assessment. Environmental Science and Technology, 54(12), pp. 7117-7125. doi: 10.1021/acs.est.0c00811
- ^ 17.0 17.1 Guo, Y., O’Neill, H., Dahlen, P., and Johnson, P.C. 2021. Evaluation of Passive Diffusive-Adsorptive Samplers for Use in Assessing Time-Varying Indoor Air Impacts Resulting from Vapor Intrusion. Groundwater Monitoring and Remediation, 42(1), pp. 38-49. doi: 10.1111/12481
- ^ Guo, Y., Dahlen, P., Johnson, P.C. 2020b. Temporal variability of chlorinated volatile organic compound vapor concentrations in a residential sewer and land drain system overlying a dilute groundwater plume. Science of the Total Environment, 702, Article 134756. doi: 10.1016/j.scitotenv.2019.134756 Open Access Manuscript
See Also
